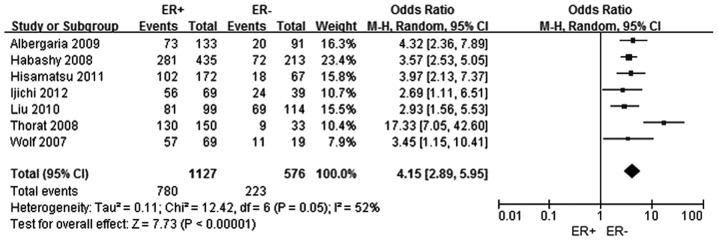
Figure 2.
Forest plot assessing the association between forkhead box protein A1 expression and the ER status in breast cancer. The center of the square indicates the study-specific OR and the horizontal lines correspond to the study-specific 95% CI. The area of the square reflects the study-specific variance. The diamond represents the pooled OR and 95% CI. ER, estrogen-receptor α; OR, odds ratio; CI, confidence interval.

