. 2016 Apr 1;11(6):2107–2116. doi: 10.3892/etm.2016.3219
Copyright: © Liu et al.
This is an open access article distributed under the terms of the Creative Commons Attribution-NonCommercial-NoDerivs License, which permits use and distribution in any medium, provided the original work is properly cited, the use is non-commercial and no modifications or adaptations are made.
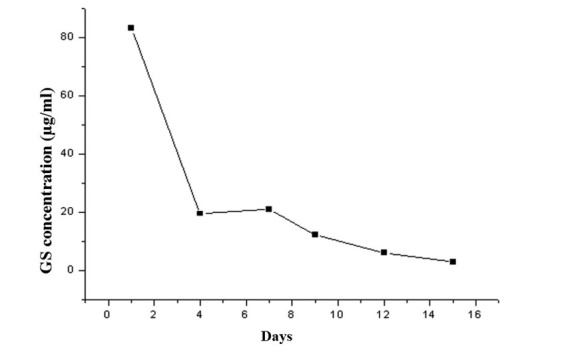
Figure 2.

Release curve of GS/DBM/PLA in vitro.
