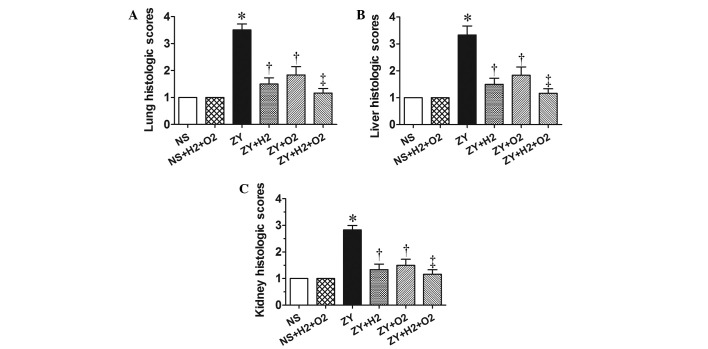
Figure 2.
Effects of H2 and/or hyperoxia on the organ histopathological scores in zymosan-challenged mice. Histological scores in the mouse (A) lungs, (B) liver and (C) kidneys. Mice were treated with or without 2% H2 and/or 98% O2 inhalation for 3 h starting at 1 and 6 h after NS or zymosan injection, respectively. At 24 h after NS or zymosan injection, all animals were anesthetized, and the organ samples were collected for measuring the histopathological scores. Values are expressed as the mean ± standard error of the mean (n=6 per group). *P<0.05 vs. NS group; †P<0.05 vs. ZY group; ‡P<0.05 vs. ZY + O2 group. NS, normal saline; ZY, zymosan.

