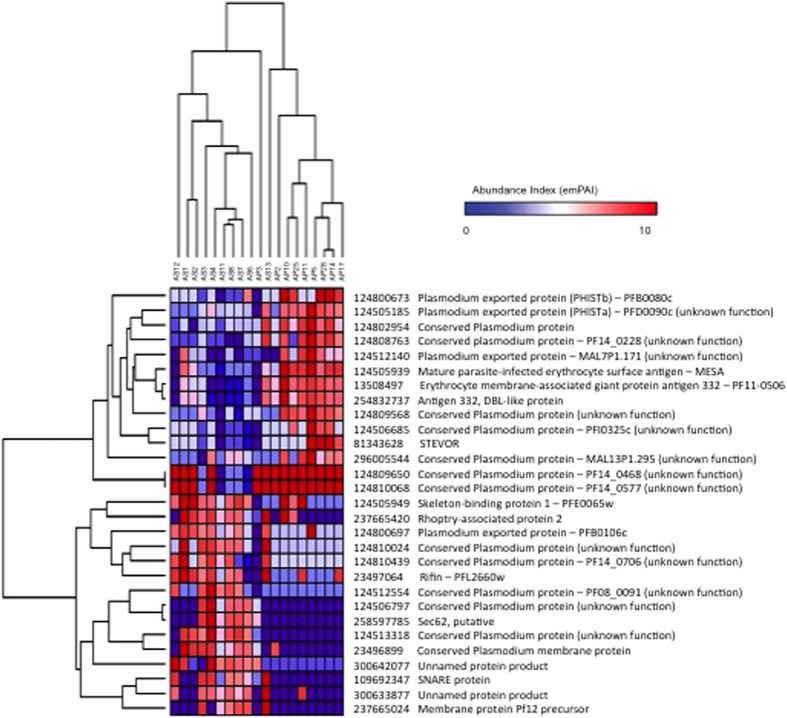
Figure 2. Hierarchical clustering analysis based on the expression profile of the 29 discriminatory proteins in the set of 19 samples.
Both samples and proteins were clustered using average linkage clustering, and with Pearson correlation as similarity metric. The samples are shown horizontally (columns), the proteins vertically (rows). The dendrograms represent the distances between clusters. In the heat map of protein expression patterns, expression levels are represented in the color scale of blue (low expression) to red (high expression).

