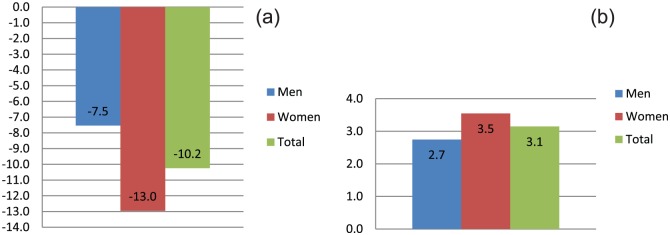
Figure 1.
Percentage change, from 2004 to 2011, in the 40 most common professions in Sweden: (a) total average days of sickness benefit, disability pension and unemployment; (b) total percentage of those taking early statutory pension, employment pension or leaving the workforce with an unregistered economic supply.

