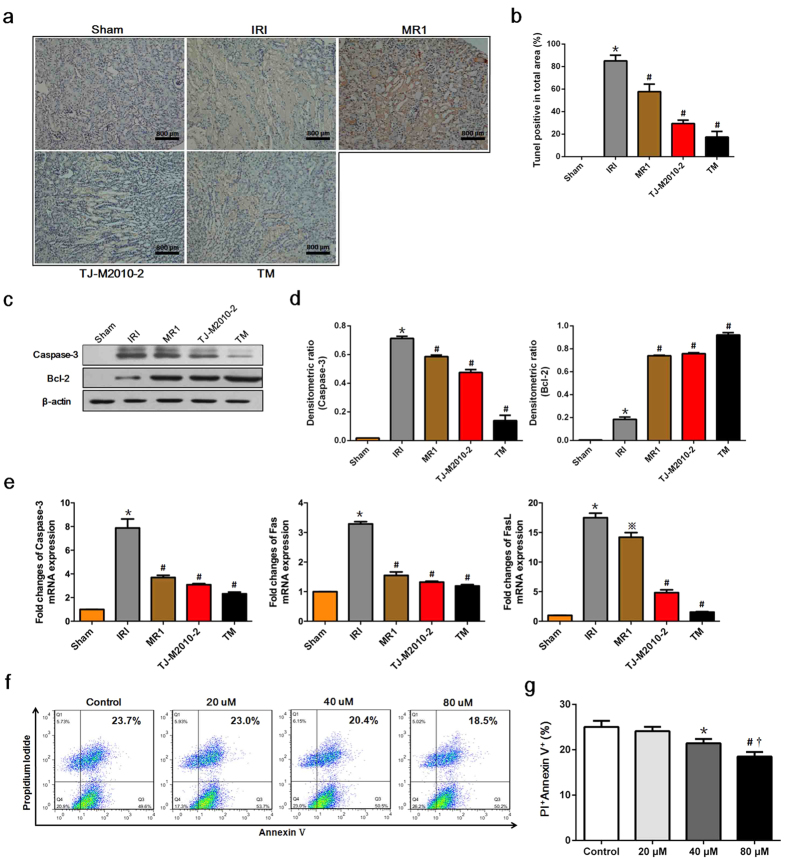
Figure 4. TJ-M2010-2 alone or with MR1 decreases IRI-induced apoptosis.
Mice were exposed to IRI for 80 min with uninephrectomy. (a) Renal tissues were dissected one day after IRI and the amount of renal apoptosis was analyzed by TUNEL assay (the same mice that were sacrificed for the assessment of pathologic damage were used for each group). Original magnification × 200 over five fields. Bar = 800 μm in all panels. (b) Semi-quantitative analysis of apoptotic area. The level of apoptosis was expressed as the percent TUNEL-positive area from total area. (*p < 0.01 versus Sham; #p < 0.01 versus IRI). Results are expressed as mean ± s.d. (c) Total proteins were extracted from the kidney one day after reperfusion. Caspase-3 and Bcl-2 protein levels were analyzed by Western Blot. (one of three independent experiments). (d) Densitometric analysis of Western Blot results. The density of each lane of β-actin was divided by that of Caspase-3 and Bcl-2 (*p < 0.01 versus Sham; #p < 0.01 versus IRI). Results are expressed as mean ± s.d. (e) RNA was extracted from kidneys one day after IRI. Caspase-3, Fas and FasL mRNA levels were measured by Real-time PCR. (*p < 0.0001 versus Sham; #p < 0.0001 versus IRI; ※p < 0.001 versus IRI). Results are expressed as mean ± s.d. (f) HK-2 cells were pre-treated with TJ-M2010-2 (20 μM, 40 μM, 80 μM) and subjected to transient ischemia followed by re-oxygen. HK-2 cells were then stained with annexin V and PI. (one of three independent experiments). (g) Quantitative analysis of the results of FCM. (*p < 0.01 versus Control; #p < 0.05 versus 40 μM; †p < 0.01 versus 20 μM). Results are expressed as mean ± s.d.

