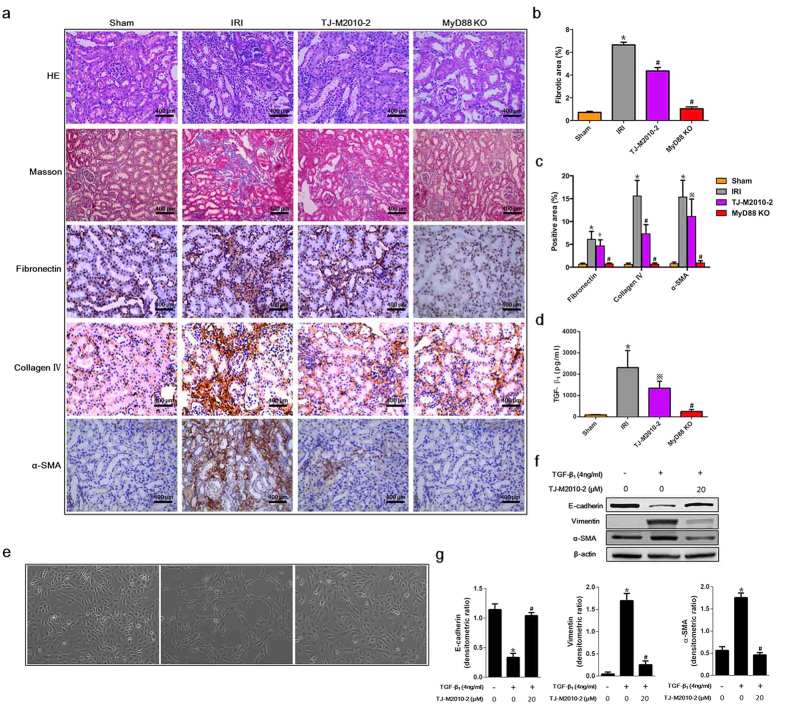
Figure 6. TJ-M2010-2 attenuates IRI-induced renal fibrosis and EMT.
Mice were exposed to IRI for 60 min without nephrectomy. (a) Left renal tissues were collected 28 days after IRI and stained with Hematoxylin & Eosin, Masson’s trichrome staining, fibronectin, collagen IV and α-SMA (six mice were sacrificed for each group). Original magnification × 400 over five fields. Bar = 400 μm in all panels. (b) Semi-quantitative analysis of the fibrotic area using Masson’s trichrome staining. (*p < 0.0001 versus Sham; #p < 0.0001 versus IRI). Results are expressed as mean ± s.d. (c) Semi-quantitative analysis of positive areas for fibronectin, collagen IV and α-SMA. (*p < 0.0001 versus Sham; †p < 0.05 versus IRI; ※p < 0.01 versus IRI; #p < 0.0001 versus IRI). Results are expressed as mean ± s.d. (d) Serum samples were collected 28 days after IRI (three of six mice sacrificed for renal function measurement for each group). TGF-β1 levels were quantified by ELISA. (*p < 0.0001 versus Sham; ※p < 0.01 versus; #p < 0.0001 versus IRI). Results are expressed as mean ± s.d. (e) Normal HK-2 cells are shown (left, Control group). HK-2 cells were treated with TGF-β1 (4 ng/ml) for 72 h (middle, TGF-β1 group). HK-2 cells were pre-treated with TJ-M2010-2 for 30 min and then TGF-β1 was given as previously described (right). One of three independent experiments is shown. Original magnification × 100. (f) Total protein was extracted after TJ-M2010-2 and TGF-β1 treatment. E-cadherin, vimentin and α-SMA protein levels were analyzed by Western blot. (one of three independent experiments). (g) Densitometric analysis of Western Blot results. The density of β-actin in each lane was divided by that of E-cadherin, vimentin or α-SMA (*p < 0.0001 versus Control group; #p < 0.0001 versus TGF-β1 group). Results are expressed as mean ± s.d.

