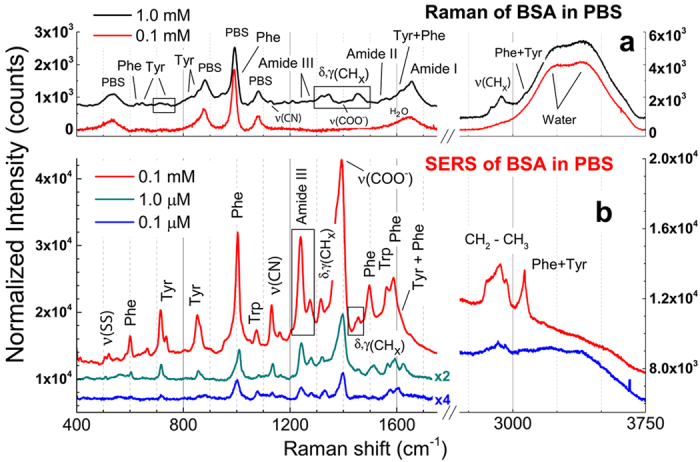
Figure 3. LIQUISOR detection of Bovine Serum Albumin.

(a) Solution phase Raman spectra of BSA in PBS at 0.1 mM (red line) and 1 mM (black line). Spectra are shifted for clarity. At 0.1 mM the signal is dominated by the PBS and water vibrations (537, 880, 993, 1081 and 1640, 2800–3700 cm−1). At 1.0 mM the fingerprint of the BSA shows up both in the low energy (400–1700 cm−1) and the high energy (2700–3200 cm−1) range. The arrows indicate the BSA modes assignment carried out by comparison with Raman of BSA in powder state (Supplementary Fig. S8) and to the literature (see Supplementary Table S2). The Phe peak at 1006 cm−1 is visible only after fitting (inset of Supplementary Fig. S8). Integration time 30 s. (b) Upon formation of the aggregates a strong SERS signal is measured at concentrations of 0.1 mM (red), down to 1 μM (green) and 0.1 μM (blue). Integration times: 5 s at 0.1 mM, 10 s at 1 μM, 20 s at 0.1 μM. Spectra are offset for clarity. All the SERS and solution phase Raman spectra are rescaled to a common integration time of 30 s, so that the intensities can be directly compared. The left hand side scales refer to the low frequency modes. The right hand scales refer to the high frequency modes. The SERS peaks are superimposed to a continuum adsorbate-induced SERS background which at the lowest BSA concentration contains a component due to the water OH stretching in the high frequency part. Experiments are carried out with laser wavelength 632.8 nm, laser power 6.7 mW, microscope objective 100X.
