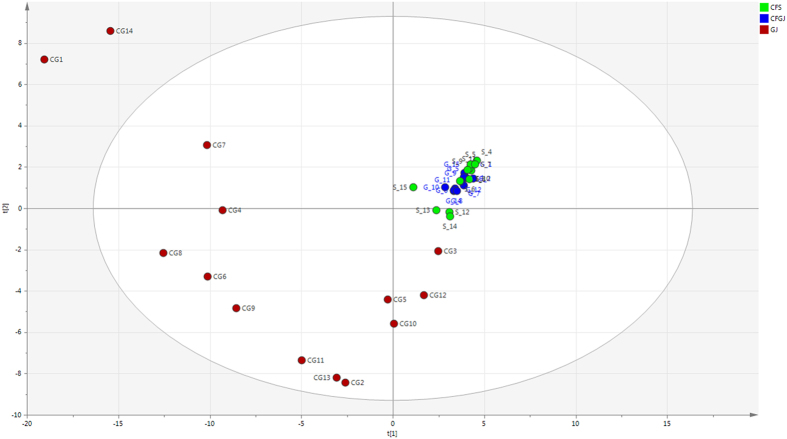
Figure 2. Partial least square discriminant analysis (PLS-DA) score scatter plot of all samples.
Non-CF gastric juice – GJ; CF gastric juice – CFGJ; Sputum samples – CFS. The Axes represent a % of variance. The CF gastric juice and sputum samples show a close relationship. In contrast the Gastric Juice samples from control patients are widely variable and clearly distinct from the CF sputum and gastric juice clustering.

