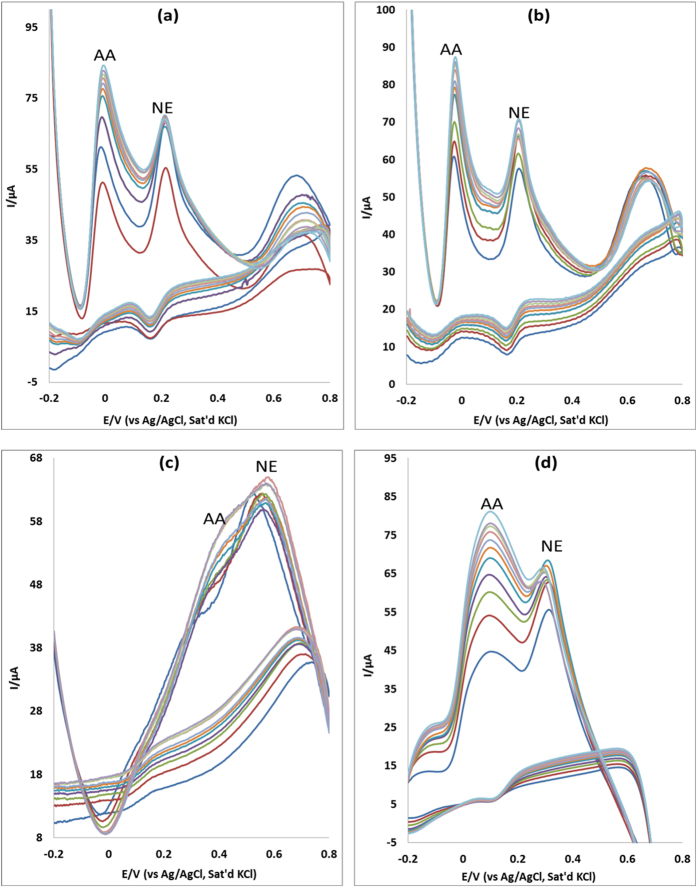
Figure 17.
Cyclic voltammograms of binary mixture of NE and AA at (a) MWCNT/Fe3O4/2,3-Nc, (b) MWCNT/Fe3O4/29H,31H-Pc, (c) MWCNT/ZnO/2,3-Nc and (d) MWCNT/ZnO/29H,31H-Pc with constant concentration of NE (0.12 mM) and increasing concentration of AA (0.32, 0.58, 0.81, 1.0, 1.2, 1.3, 1.4, 1.6, 1.7, 1.8 mM).

