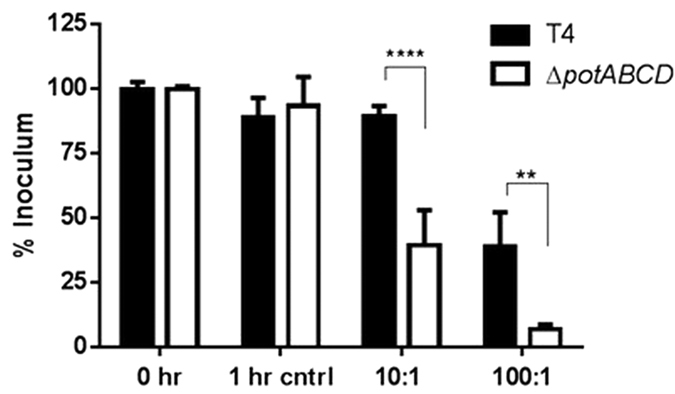
Figure 4. Opsonophagocytosis of S. pneumoniae TIGR4 and ΔpotABCD at two different bacteria: neutrophil ratios (1:10 and 1:100).

1 hr control represent the reaction mixture with neutrophils with no bacteria and T4 represents TIGR4. Data are represented as mean ± SEM. Two-way ANOVA and Sidak’s multiple comparison test were used to calculate the statistical significance (**p-value = 0.003; ****p-value = <0.0001).
