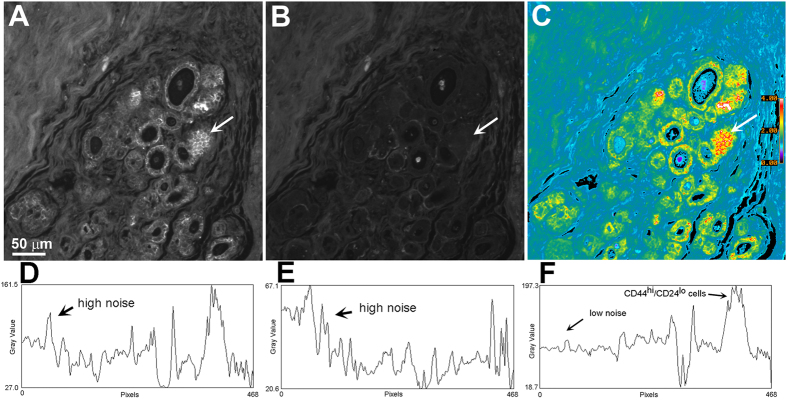
Figure 1. Illustration of BRIM.
A DCIS section was labeled with anti-CD44 (A) and anti-CD24 (B). (Panels A,B) were prepared identically. (Panel C) reveals intraductal CD44hi/CD24lo cells at high contrast. The white arrows identify a region of CD44hi/CD24lo cells that are included in the quantitative line profile analyses of (panels D–F). (Panels D–F) show quantitative line profile analyses (the line profile extends from the right to left hand sides of the image at the level of the arrow). Noise reduction and contrast enhancement are seen in the ratio image of (panel F). The pseudocolor image in (panel C) is scaled as indicated by the bar on the right side. (Distance scale range is shown on the lower left side of (panel A).

