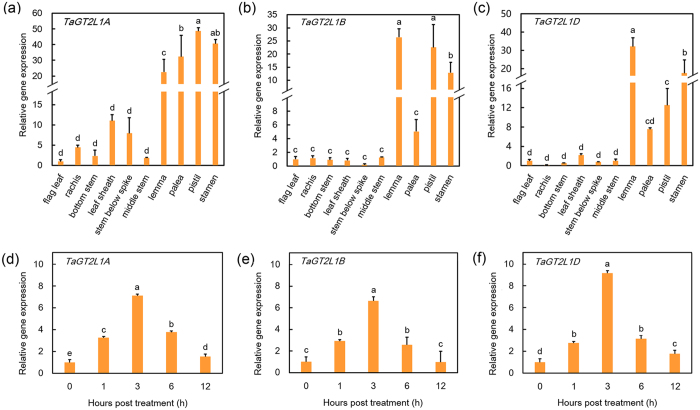
Figure 2. TaGT2L1 expression patterns.
Expression patterns of TaGT2L1A (a), TaGT2L1B (b), and TaGT2L1D (c) in different tissues were analysed at the anthesis stage. Changes in the expression patterns of TaGT2L1A (d), TaGT2L1B (e), and TaGT2L1D (f) in response to exposure to 20% (w/v) PEG6000 were analysed using one-week-old wheat seedling leaves. Total RNA was isolated and reverse-transcribed (n = 6). The qPCR was performed using TaACTIN gene as an internal reference. All values are the means ± standard deviations of three independent experiments. Different letters indicate significant differences (Student-Newman-Keuls test, P < 0.05).

