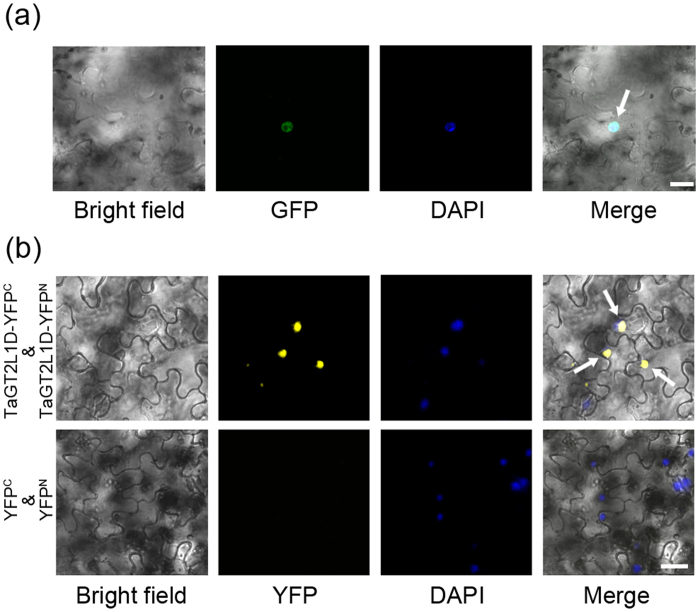
Figure 3. Subcellular localization of TaGT2L1D.
(a) The construct harboring GFP-TaGT2L1D was transiently transformed to N. benthamiana leaves. (b) The construct harboring TaGT2L1D-YFPC and TaGT2L1D-YFPN were transiently co-transformed to N. benthamiana leaves. Constructs harboring YFPC and YFPN were used as negative control. All transformed leaves were stained with DAPI and then photographed by confocal microscopy. Bright field images show the complete epidermal cell profile in bright-field view, GFP/YFP or DAPI images show fluorescent signals in dark view, and Merge images show the overlay of three signals including bright field, GFP/YFP fluorescence and DAPI fluorescence. White arrows indicate the GFP or YFP fluorescence merged to the DAPI fluorescence. Scale bar = 50 μm.

