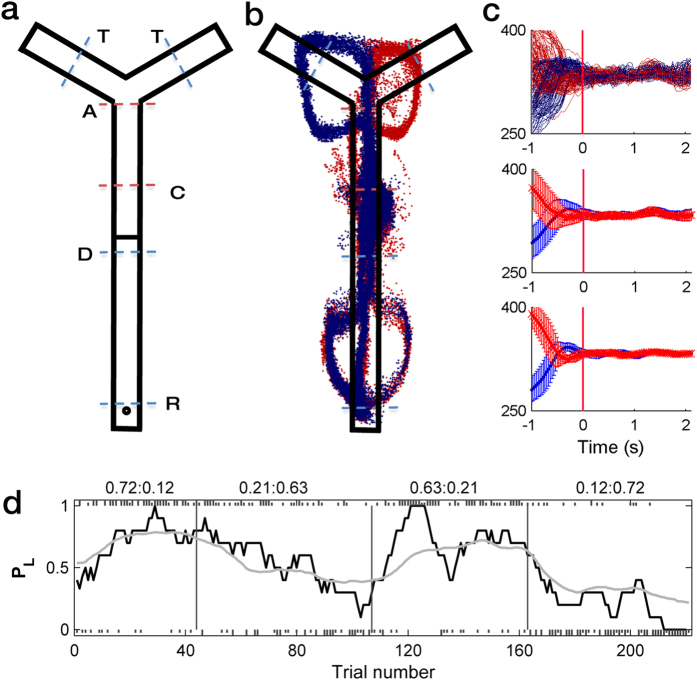
Figure 1. Animal behavior.
(a) Behavioral task. In each trial, following a 2-s delay at the delay point (D), the animal was required to choose either the left or right target (T) by checking a photobeam sensor (blue dashed lines on top), return to the reward location (R, circle), and wait for 1 s to obtain the water reward. Approximate spatial positions for the divergence (outbound) and convergence (inbound) of left- and right-choice-associated movement trajectories, which were determined separately for each session, are indicated as A (approach) and C (convergence), respectively (red dashed lines). (b) An example of movement trajectory for one session. Blue, left choice; red, right choice. Each dot represents the animal’s head position at 33.3 ms time resolution. (c) Determination of the convergence point. X-coordinates of the animal’s head position data were temporally aligned to the time point 3 s prior to the reward stage onset. The first time point when the difference in X-coordinates of the left- and right-choice trials became statistically insignificant (t-test, p > 0.05) and remained that way for at least nine consecutive points (300 ms) was determined as the convergence point (red vertical line). Top, X-coordinates of all left-choice and right-choice trials in an example session; middle, mean (±SD across trials) X-coordinates of the left-choice and right-choice trials of the same session; bottom, mean X-coordinates of the left-choice and right-choice trials were averaged across sessions (±SD). The data was aligned to the convergence point (time 0) that was determined separately for each session. (d) Choice behavior of one animal in one example session. Tick marks denote trial-by-trial choices of the animal (upper, left choice; lower, right choice; long, rewarded trial; short, unrewarded trial). Vertical lines denote block transitions and numbers on the top indicate mean reward probabilities associated with left and right choices in each block. The black line shows the probability to choose the left target (PL) in a moving average of 10 trials, and the gray line shows PL predicted by the hybrid model.

