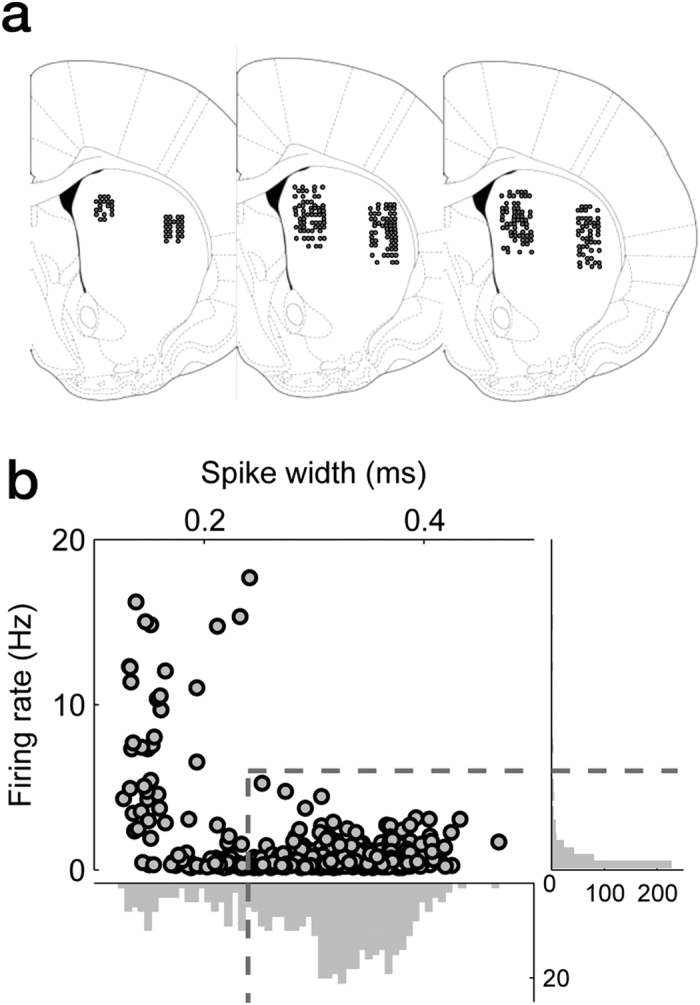
Figure 2. Recording locations and unit classification.

(a) Single units were recorded from the DMS and the DLS. The diagrams are coronal section views of three rat brains at 0.48 mm anterior to bregma. Each diagram represents one rat and each circle represents one recording site that was determined based on histology and electrode advancement history. One to six units were recorded simultaneously from each site. Modified from ref. 49 with permission from Elsevier. (b) Unit classification. Recorded units were classified into putative MSNs and putative interneurons based on mean discharge rate and spike width. Those units with mean firing rates <6 Hz and spike widths ≥0.24 ms were classified as putative MSNs, and the rest were classified as putative interneurons.
