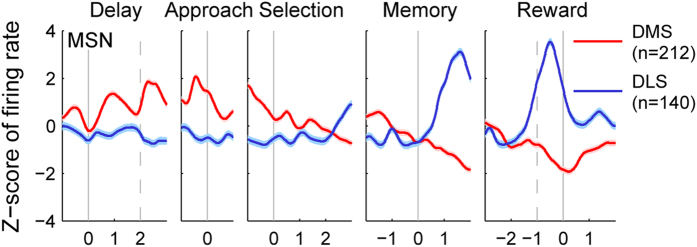
Figure 3. Temporal profiles of neuronal activity.
Mean discharge rates of putative MSNs were compared between the DMS (red) and DLS (blue). The graphs show z-scores of discharge rates of putative MSNs across different behavioral stages (delay, approach to target, target selection, memory, and reward). A spike density function was constructed for each neuron by applying a Gaussian kernel (σ = 100 ms) and then z-normalized based on the mean and SD of discharge rate in 10-ms time bins. Shading indicates 95% confidence interval. Each solid vertical line indicates the beginning of a given behavioral stage. Dashed vertical lines denote delay stage offset (left) and the animal’s arrival at the reward location (right).

