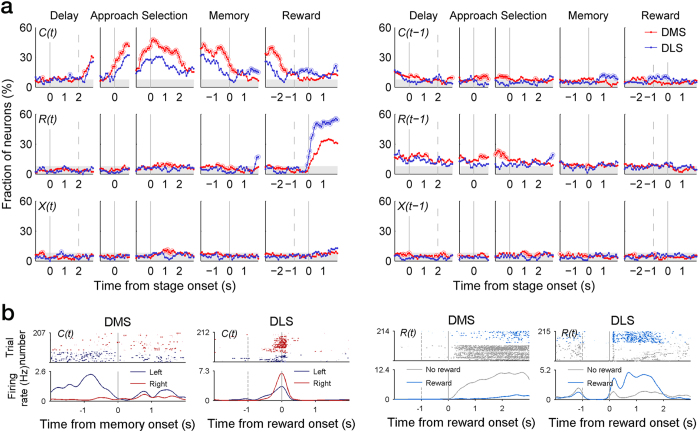
Figure 4. Neural activity related to the animal’s choice and its outcome.
(a) Shown are fractions of DMS and DLS MSNs that significantly modulated their activity according to the animal’s choice (C), its outcome (R), and their interaction (X) in the current (t) and previous (t − 1) trials in a 500-ms time window that was advanced in 100-ms time steps across different behavioral stages. Shading indicates chance level (binomial test, alpha = 0.05) for the DLS (7.86%), which is slightly higher than that for the DMS (7.55%). Large open circles indicate significantly different fractions (χ2-test, p < 0.05) between DMS and DLS. Behavioral stages and vertical lines are as shown in Fig. 3. (b) Examples of MSNs responsive to animal’s choice (C) or its outcome (R) in the current trial (t). Top, spike raster plots. Each row is one trial, and each dot represents a spike. Bottom, spike density functions. Trials were divided into two groups according to the animal’s target choice (left vs. right) or reward (rewarded vs. unrewarded).

