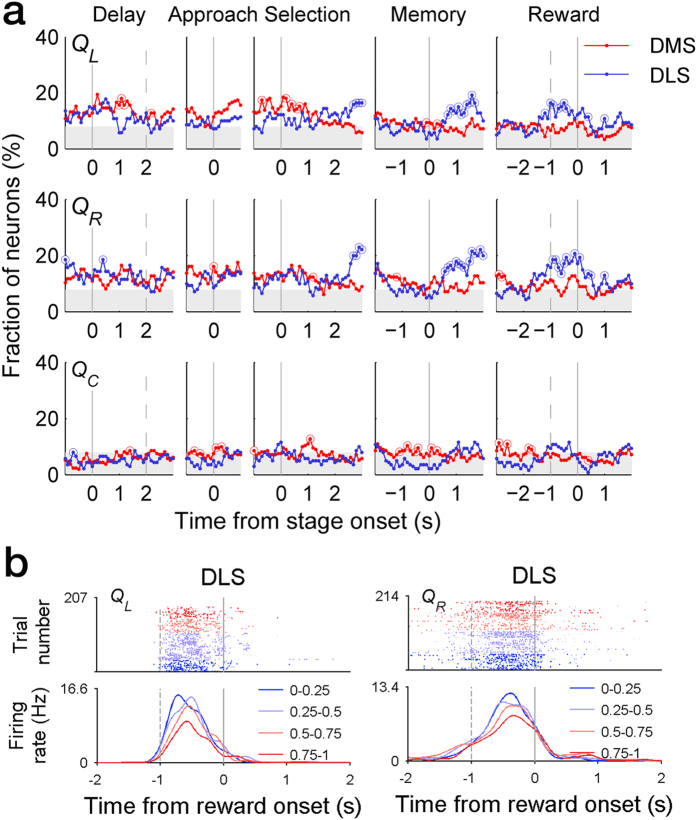
Figure 5. Temporal profiles of value-related neural activity.
(a) Shown are fractions of DMS and DLS MSNs that significantly modulated their activity according to left action value (QL), right action value (QR), and chosen value (QC). Analysis time windows and shading are as shown in Fig. 4a. (b) Two examples of DLS MSNs coding action value. Top, spike raster plots. Bottom, spike density functions. Trials were divided into four groups according to the level of QL (left) or QR (right).

