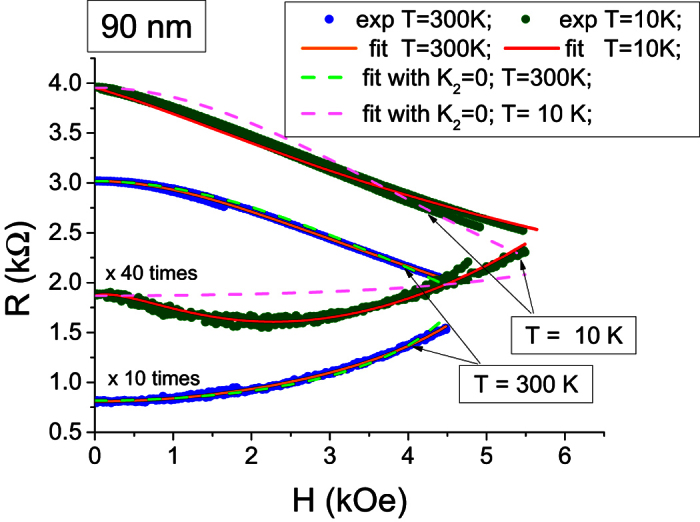
Figure 5. Fitting of the MR(H) loop at T = 300 K and T = 10 K.

Extracted values for model (3): T = 300K:  = 2815 Oe,
  = −294 Oe;
  = 11084 Oe,
  = −2935 Oe; T = 10K:
  = 5184 Oe,
  = −1034 Oe;
  = 37285 Oe,
  = −19178 Oe. The sub-indexes F and R specify free and reference layers’ constants respectively.
