
Figure 8. M(H) curves for three samples around the anisotropy reorientation transition.
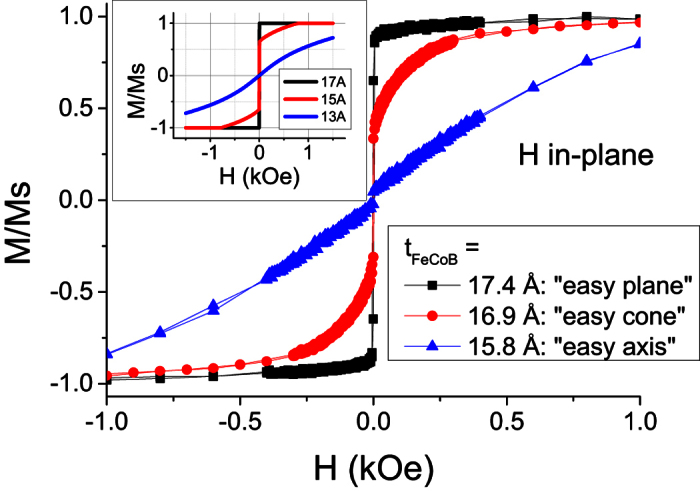
Z-axis is out-of-plane. The field is applied in-plane. The inset shows simulated M(H) dependences for three different thicknesses using the model (3) with MS = 1000 emu/cm3, K1S = 1 erg/cm2, K2S = −0.05 K1S.