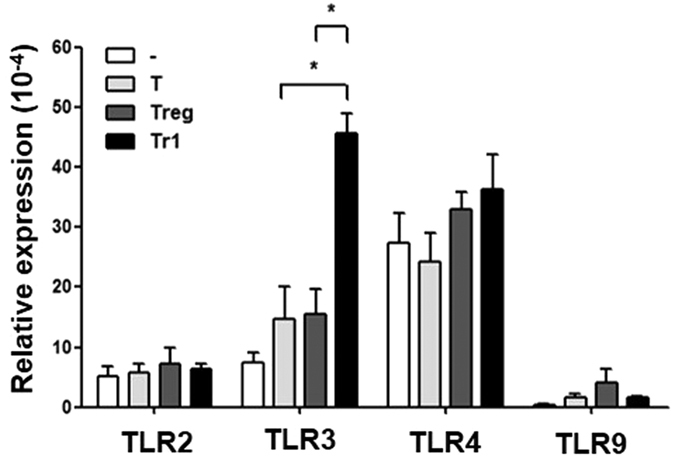
Figure 4. TLR mRNA expression by co-culturing MSCs with T, Treg, or Tr1 cells.

TLR expression in MSCs was assessed using real-time PCR. MSCs were isolated by negative selection of CD4+ T cells in MSCs alone (n = 7) and co-cultured with T (anti-CD3, anti-CD28) (n = 4), Treg (anti-CD3, anti-CD28, anti-IFN-γ, anti-IL-4, recombinant TGF-β, and retinoic acid) (n = 7), or Tr1 (anti-CD3, anti-CD28, Dex, and Vit D3) (n = 7) cells co-cultured with MSCs for 24 h. All graphs display the means ± SEM; results are representative of two independent experiments and statistical significance was determined by Student’s two-tailed t-test and ANOVA with Bonferroni correction for multiple comparisons (*p < 0.05).
