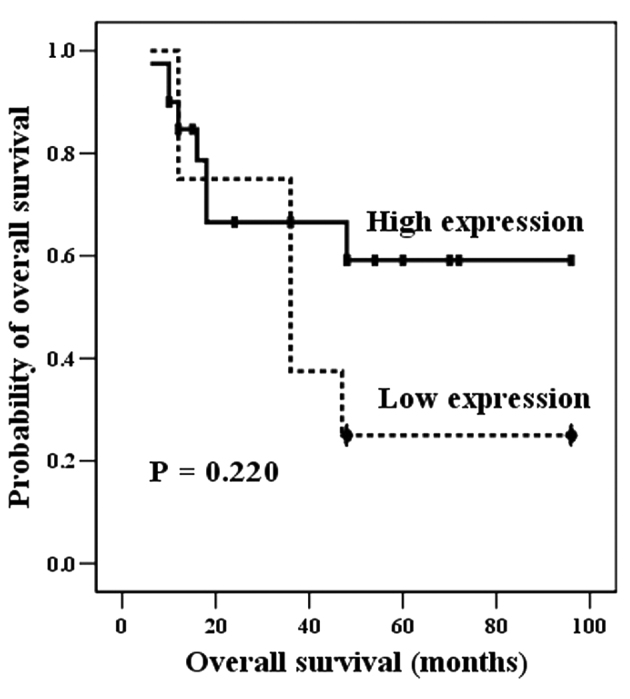
Figure 3.

Univariate analysis (Kaplan-Meier curve) demonstrated that high Gsα expression was inclined to indicate more favorable clinical behavior, compared with low Gsα expression, although this was not statistically significant (P=0.220). Gsα, G-protein α subunit.
