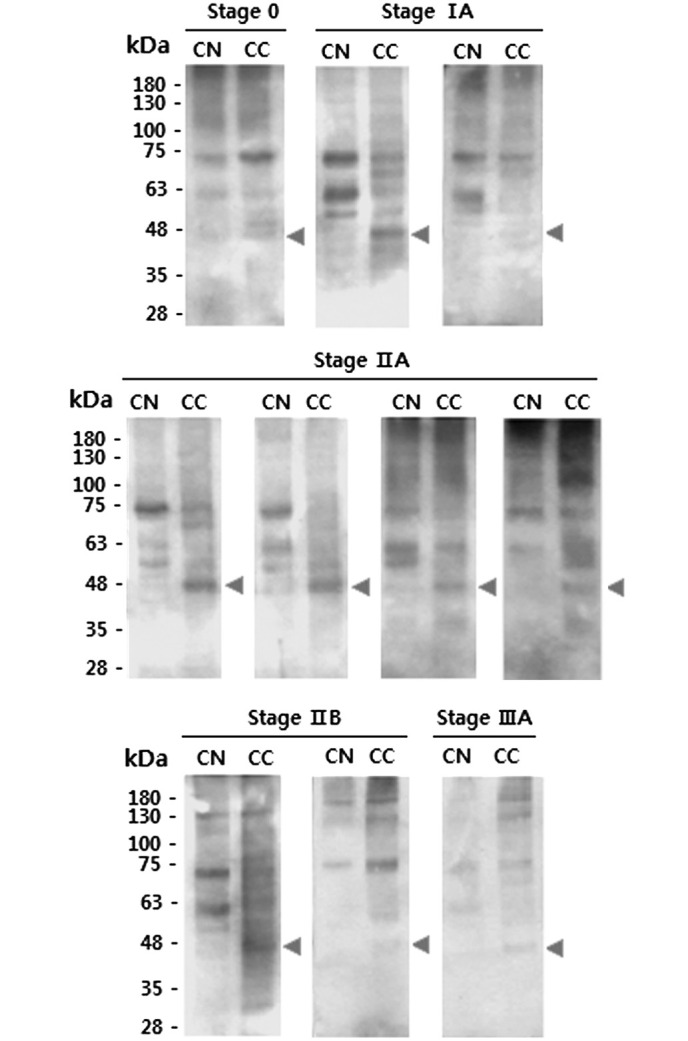
Figure 4.

Results of concanavalin A blots comparing CNs and CCs. CNs and CCs from the same patients were compared. Triangles indicate CC-specific proteins. Specimens used were as follows: Stage 0, no. 1; stage IA, no. 3 and 4; stage IIA, no. 5, 6, 7 and 8; stage IIB, no. 9 and 10; stage IIIA, no. 11 (see Table I). CC, cancer tissue; CN, normal tissue.
