.
-
A
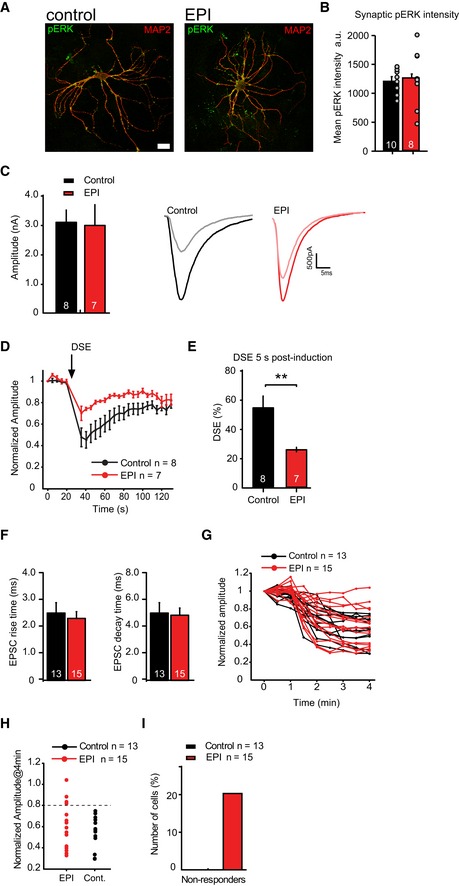
Typical examples of isolated neurons pretreated with ERK inhibitors (EPI) or DMSO (control) for 3 h. Dendritic marker MAP2 (red), phospho‐ERK antibody (pERK, green). Scale bar represents 10 μm.
-
B
Semi‐quantitative analysis of phospho‐ERK intensities at synapses (identified by VAMP2, not shown) shows that pretreatment with ERK inhibitors does not result in reduction of phospho‐ERK levels in all neurons (control
n = 10 neurons, EPI
n = 8 neurons). In these neurons, ERK appears to remain in a phosphorylated state much longer than in hippocampal slices (compare with Fig
3C).
-
C–E
DSE duration and amplitude is decreased in hippocampal autaptic neurons upon ERK pathway inhibition compared to control. (C) Left: Average EPSC amplitude in wild‐type autaptic neurons before a 10‐s depolarizing pulse in control and ERK pathway inhibitors (EPI: 20 μM PD98059 and 10 μM U0126, applied 3 h before recordings) pretreated neurons is similar (control: 3.1 ± 0.4 nA, n = 8; EPI: 3.0 ± 0.7 nA, n = 7). Right: Examples of average EPSC traces for control (black and gray) and EPI (red and pink)‐treated neurons prior to and after DSE, respectively. (D) Time course of normalized EPSC amplitudes recorded before and after a 10‐s depolarizing pulse to 0 mV (DSE, indicated by the arrow) in wild‐type autaptic neurons in the absence (control) or presence of ERK pathway inhibitors (EPI) (control n = 8, EPI
n = 7 from 2 independent experiments). (E) DSE effect size in control and EPI‐treated autapses 5 s after a 10‐s depolarizing pulse to 0 mV (control n = 8, EPI
n = 7, **P < 0.01, Mann–Whitney U‐test).
-
F–H
ERK pathway inhibitors block effect of CB1 agonist WIN55,212‐2 in a subset of hippocampal autaptic neurons. (F) EPSC rise and decay times of control (black bars) and EPI (red bars)‐treated neurons prior to WIN55,212‐2 application are similar. (G) Effect of 1 μM WIN application in individual cells after 4 min (start of application is at t = 1 min) in the absence (control, n = 13) and presence of ERK pathway inhibitors (EPI: 20 μM PD98059 and 10 μM U0126, applied 3 h before recordings, n = 15). (H) Normalized EPSC amplitudes 4 min after WIN application in control and EPI neurons. The dashed line represents cutoff used to distinguish non‐responders (EPSC rundown < 20%) and responders (EPSC rundown > 20%) in (G).
-
I
Ratio of non‐responding versus responding neurons to 1 μM WIN application shows that in 20% of EPI‐treated neurons, EPSC during WIN application remained above 80% of EPSC before WIN stimulation. In control cells, WIN application resulted in > 20% reduction of EPSCs in all neurons tested.
Data information: Data are expressed as mean ± SEM.

