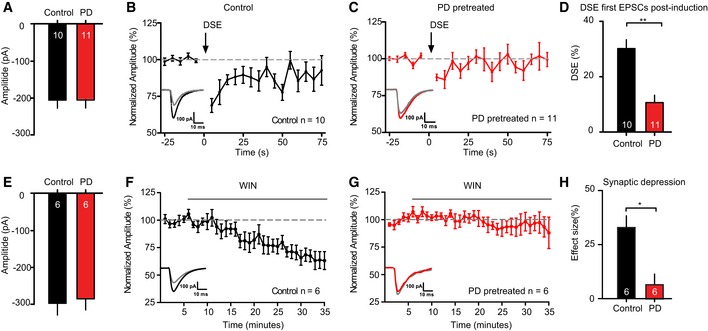
Figure 7. ERK pathway inhibition decreases DSE and WIN55,212‐2‐induced depression.

-
A–DDSE duration and amplitude is decreased in CA1 pyramidal neurons upon ERK pathway inhibition by a pretreatment with PD98059 (PD; 10 μM) compared to 0.1% DMSO (control). (A) Average EPSC amplitude during 25‐s baseline recording prior to DSE induction shows no significant differences in EPSC amplitude between the DMSO‐ and PD‐pretreated groups (DMSO: 196.36 ± 16.51 pA, n = 10; PD: 196.42 ± 18.61 pA, n = 11, P = 0.9). (B) Average DSE in neurons of DMSO‐pretreated slices, induced by a 10‐s depolarization to 0 mV (arrow), n = 10. Inset: example traces of 2 averaged EPSCs before (black) and after depolarization (gray). (C) Average DSE in slices pretreated with PD (n = 11). Insets: example traces of 2 averaged EPSCs before (red) and after depolarization (gray). (D) Comparison of DSE between control and PD. PD pretreatment limits amplitude and duration of DSE. **P < 0.01; unpaired t‐test with Welch's correction. Numbers in bars represent the number of neurons in each group.
-
E–HERK pathway inhibition by pretreatment with PD98059 (PD; 10 μM) blocks the effect of WIN55,212‐2 (WIN; 2 μM) on the amplitude of EPSCs recorded in CA1 pyramidal neurons. (E) Average EPSC amplitude during 5‐min baseline recording prior to DSE induction shows no significant differences in EPSC amplitude between the DMSO‐ and PD‐pretreated groups (DMSO: 295.69 ± 28.73 pA, n = 6; PD: 270.86 ± 32.14 pA, n = 6, P = 0.6). (F) Effect of WIN application (gray bar, 30 min) on EPSC amplitude in CA1 pyramidal neurons of 0.1% DMSO (control)‐pretreated slices (n = 6). Inset: example traces of averaged EPSCs of baseline (black) and the last 5 min (gray). (G) Effect of WIN application (gray bar, 30 min) on EPSC amplitude in CA1 pyramidal neurons of PD‐pretreated slices (n = 6). Inset: example traces of averaged EPSCs of baseline (red) and the last 5 min (gray). (H) Comparison of the effect size of the last 5 min in both groups shows a significant difference. *P < 0.05; unpaired t‐test. Numbers in bars represent number of slices in each group.
