
Figure EV2. Translation efficiencies of the reporters used in Fig 3A and B.
-
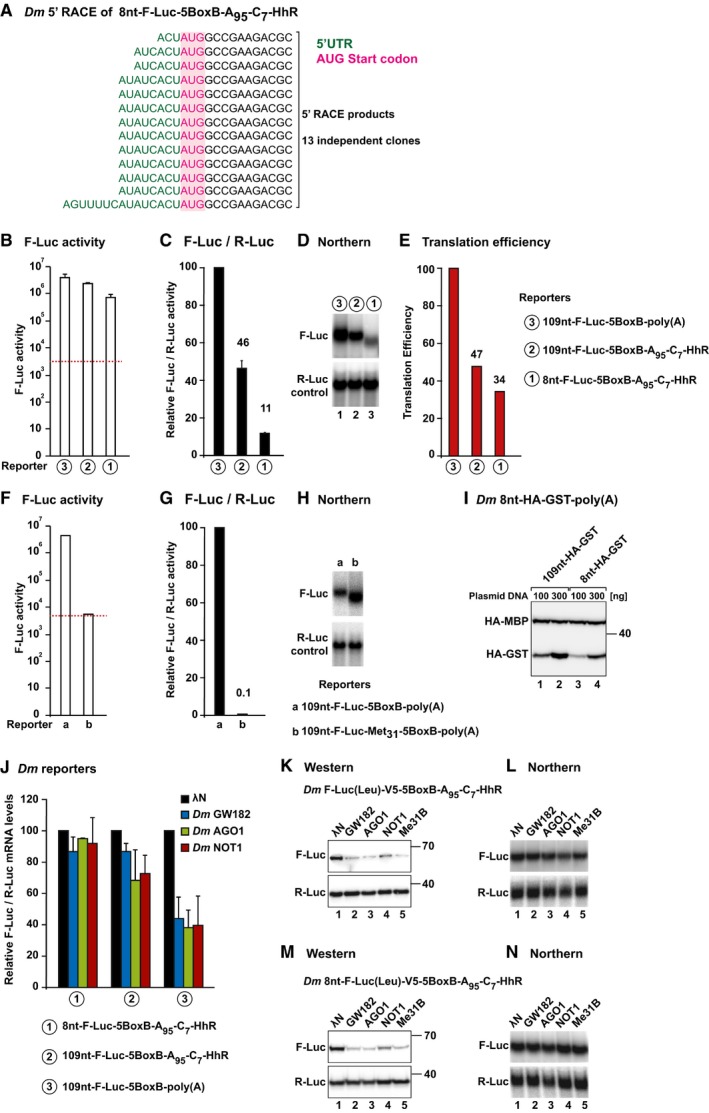
A5′ RACE sequences obtained in S2 cells expressing the 8nt‐F‐Luc‐5BoxB‐A95C7‐Hhr reporter after cloning the RACE products.
-
B–ES2 cells were transfected with the F‐Luc‐5BoxB reporters shown in Fig 3A. (B) Absolute values of luciferase activity (not normalized). Background levels are indicated by a dashed red line. (C) Luciferase activity normalized to that of the R‐Luc transfection control and set to 100 for the polyadenylated reporter containing a 109‐nt 5′‐UTR. (D) Northern blot of representative RNA samples. (E) The translation efficiency for each reporter was calculated by dividing the normalized values for F‐Luc activity shown in (C) by the normalized mRNA levels, shown in (D). Translation efficiencies were set to 100% for the polyadenylated reporter containing a 109‐nt 5′‐UTR. Note that although the translation efficiency of the reporters lacking a poly(A) tail is reduced, the absolute F‐Luc values are three orders of magnitude greater than background levels (B).
-
F–HA 109‐nt‐F‐Luc‐5BoxB‐poly(A) reporter containing a N‐terminally truncated F‐Luc ORF starting at Met31 is expressed, but no F‐Luc activity is detected above background (red dashed line). These results indicate that F‐Luc activity will not be detectable if ribosomes bypass the first AUG and start translation at the first in‐frame Met31.
-
IWestern blot analysis showing the expression of HA‐GST reporters containing 5′‐UTRs of 109 nt (lanes 1 and 2) and 8 nt (lanes 3 and 4). Transfection mixtures contained either 100 or 300 ng of reporter plasmids. HA‐MBP served as a transfection control.
-
JNormalized luciferase mRNA levels corresponding to the experiment shown in Fig 3B.
-
K–NRepresentative Western and Northern blots corresponding to the experiments shown in Fig 3D and E.