
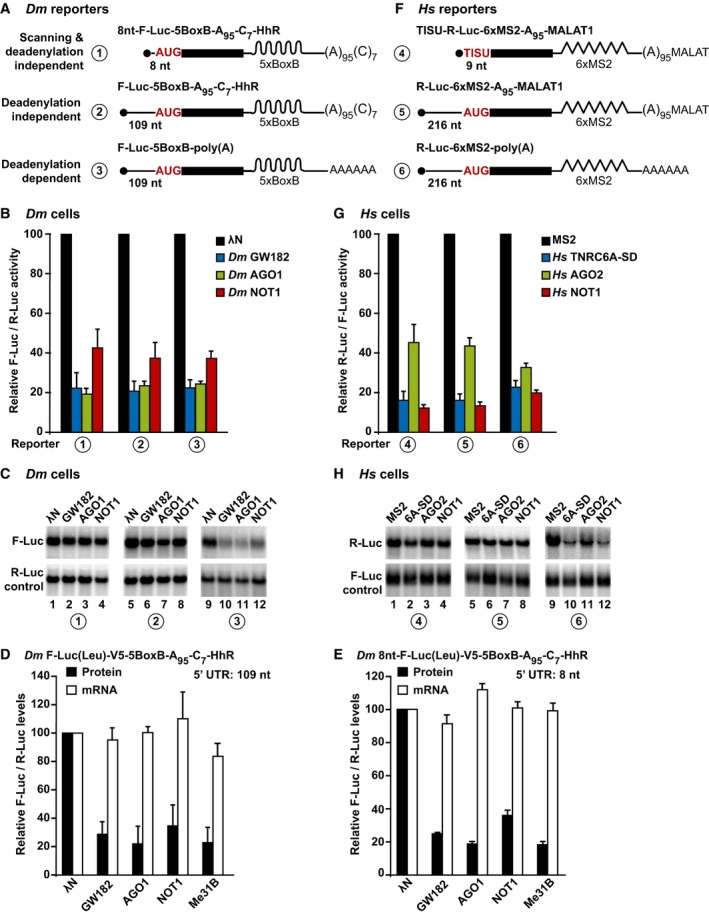
Figure 3. AGO, GW182/TNRC6, and NOT1 silence mRNA reporters translated via a scanning‐independent mechanism.
-
ASchematic representation of the Dm reporters used in panels (B, C).
-
B, CTethering assay using the F‐Luc‐5BoxB reporters shown in panel (A) and λN‐HA‐tagged GW182, AGO1, and NOT1 in S2 cells. F‐Luc activity and mRNA levels were normalized to those of the R‐Luc transfection control and analyzed as described in Fig 2A and B. Quantification of the corresponding Northern blots is shown in Fig EV2J.
-
D, ETethering assay with the indicated reporters containing a F‐Luc(Leu)‐V5 fusion in which all in‐frame methionines were replaced with leucine. The corresponding Western and Northern blots are shown in Fig EV2K–N.
-
FSchematic representation of the reporters used in panels (G, H).
-
G, HTethering assay using the R‐Luc‐6xMS2 reporters shown in panel (F) and HA‐MS2‐tagged TNRC6A‐SD, AGO2, and NOT1 in HEK293T cells. R‐Luc activity and mRNA levels were normalized to those of the F‐Luc transfection control and analyzed as described in Fig 2C and D. The corresponding quantification of mRNA levels is shown in Fig EV3F.