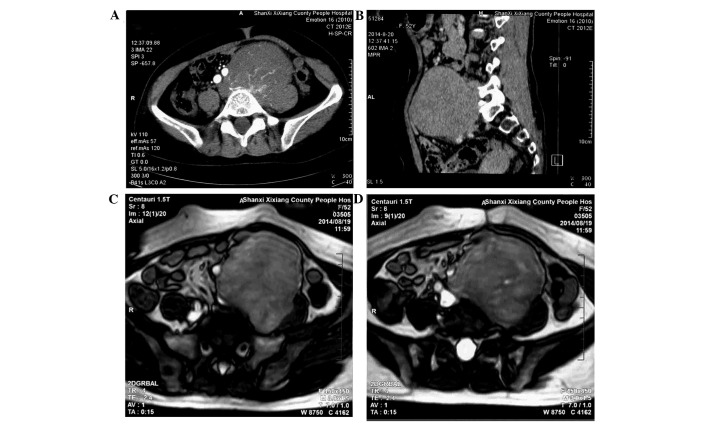
Figure 1.
Abdominal CT scan revealing a 10×9×8-cm, low-density soft tissue heterogeneous mass with a clear boundary in the left lower quadrant. The CT value was 36 Hu. (A) During the arterial phase, multiple rete vasculums were observed in the lesion and (B) multiple rete vasculums aggregated uniformly in the venous phase. Magnetic resonance imaging scan showing (C) an equal or low signal on T1-weighted images and (D) a mixed high signal on T2-weighted images. (C and D) The vessels close to the tumor had been oppressed and shifted, and the surrounding fat gap of the tumor was clear. CT, computed tomography.

