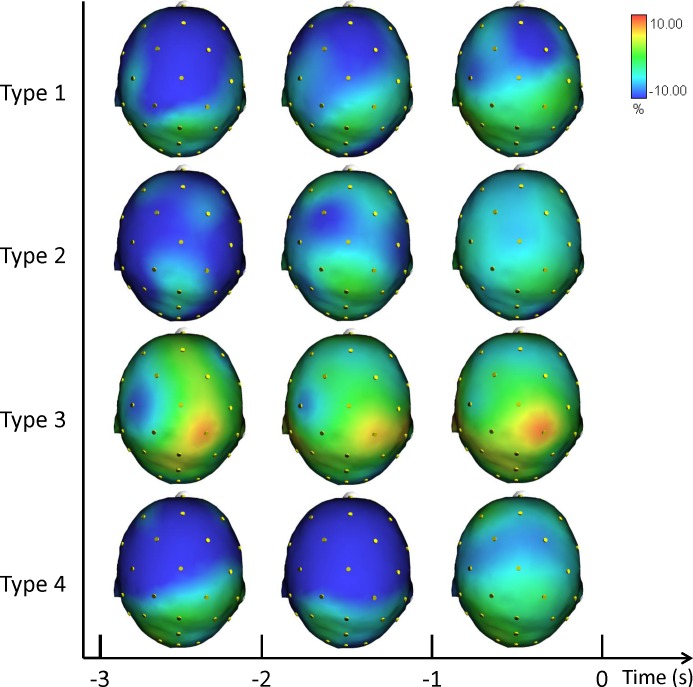
Figure 2. Average topographical distributions of the ERD/ERS amplitudes in the theta band for each performance type during the 3 s before shot release.
The theta ERD/ERS maps were calculated for three pre-shot periods: from −3 s to −2 s, from −2 s to −1 s, and from −1 s to shot release (t = 0). Time scale is on the X axis. Color scale: maximum ERD and ERS are coded in red and blue, respectively. The maximal (%) value of the ERD/ERS is given at the top right side of the figure.

