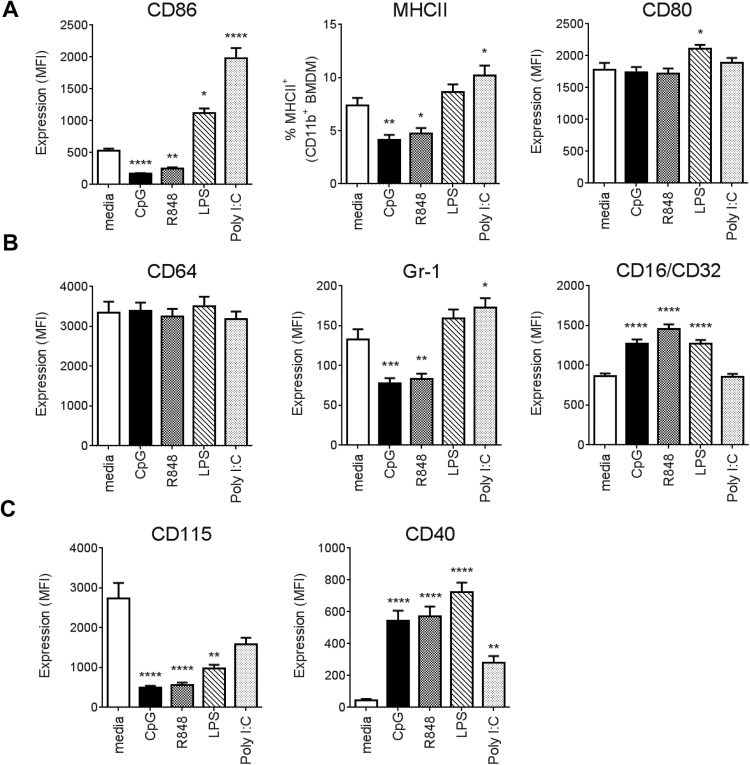
Fig. 2.
TLR7/9 ligands down-regulate co-stimulatory molecules. BMDMs were collected on day 7 and stimulated overnight (18–22h) with TLR ligands. Surface expression of (A) CD86, MHCII, CD80, (B) CD64, Gr-1, CD16/CD32 and (C) CD115 and CD40 was measured by flow cytometry on CD45+, live, CD11b+CD64+ macrophages. Bars represent mean + SEM obtained from at least three independent experiments with minimum n = 10 per condition. P values were calculated by one-way ANOVA followed by a multiple comparisons test. *P < 0.05, **P< 0.01, ***P < 0.001, ****P < 0.0001 (compared to media).

