Figure 2.
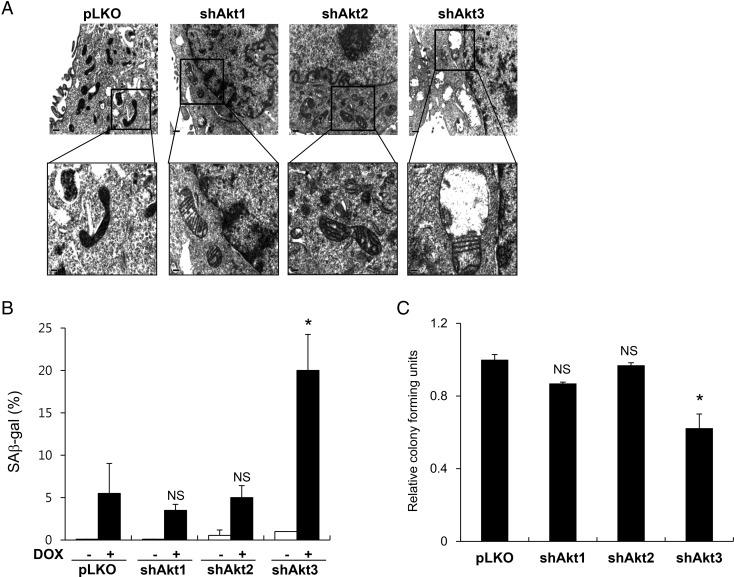
Mitochondrial structural and functional defects following knockdown of Akt protein isoforms in EJ cells (A) Representative electron microscopy images of mitochondria in control EJ cells (pLKO) and in EJ cells expressing shAkt1, shAkt2, or shAkt3. The upper panels show ×20,000 magnification, and the indicated regions are enlarged in the bottom panel (×40,000). (B) Cells were treated with 25 nM DOX for 16 h. After 6 days of culture in DOX-free media, the cells were stained with freshly prepared SA β-gal staining solution. SA β-gal-positive cells counted in three independent experiments were presented as mean values with standard deviations. (C) A total of 500 cells were seeded per well in 6-well culture plates and cultured in DMEM-galactose media. After 2 weeks, the resulting colonies were fixed, stained with methylene blue, and counted. Each experiment was independently repeated in triplicate, and the results were presented as the mean values with standard deviations. *P< 0.05 compared with pLKO vector control cells using Student's t-test. NS, not significant.

