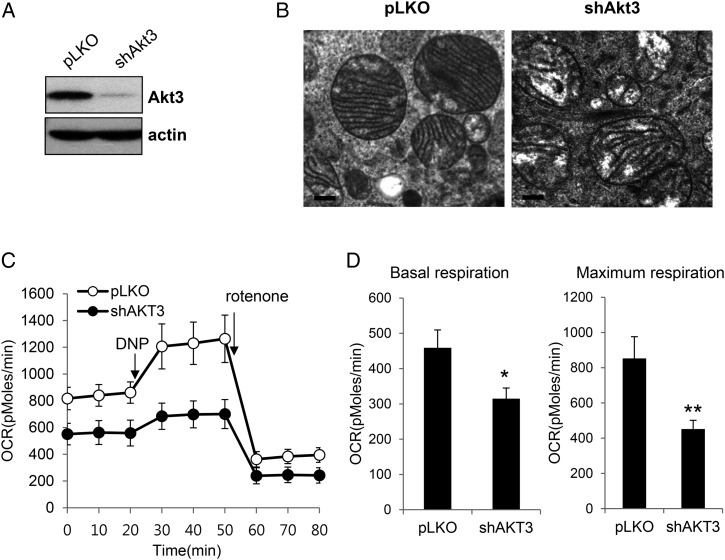
Figure 4.
Effect of Akt3 knockdown on the mitochondrial mass and respiration rate in A549 cells (A) A549 cells expressing either the shAkt3 or pLKO vector were lysed and subject to western blotting using the indicated antibodies. The data shown are representative of three independent experiments. (B) Representative electron microscopy images of mitochondria in control A549 cells (pLKO) and in A549 cells expressing shAkt3. The images show ×40,000 magnification. (C) The respiration rates were measured using the XF24 flux analyzer as described in Fig. 3. Representative analyses of oxygen consumption performed in triplicate are shown. (D) The averaged metabolic profiles of three repeated experiments. The results are presented as mean values with standard deviations. *P< 0.05, **P< 0.01 compared with pLKO vector control cells using Student's t-test.

