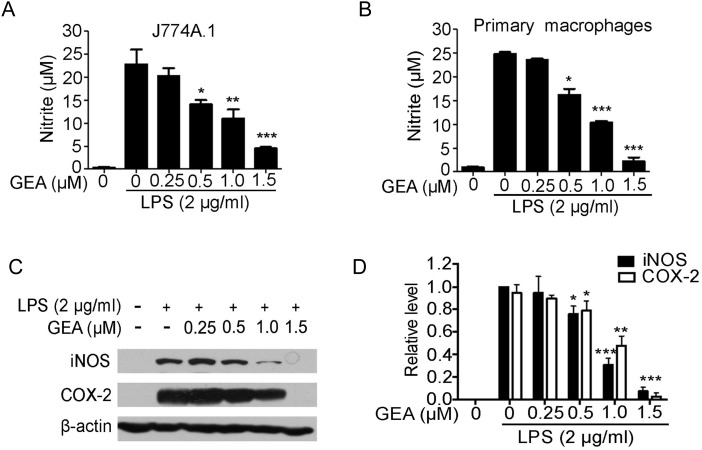
Figure 2.
Effect of GEA on NO production and LPS-induced iNOS and COX-2 expression J774A.1 cells (A) and murine primary peritoneal macrophages (B) were treated with indicated concentrations of GEA for 1 h before LPS (2 μg/ml) treatment. After 24 h of treatment, the amounts of NO in the culture supernatants were measured. (C) The levels of iNOS and COX-2 protein were assessed by western blot analysis. β-Actin was used as an internal control. (D) The expression levels of iNOS and COX-2 protein were normalized to β-actin. Data are representative of three independent experiments. *P < 0.05, **P < 0.01, and ***P< 0.001 vs. LPS alone group.

