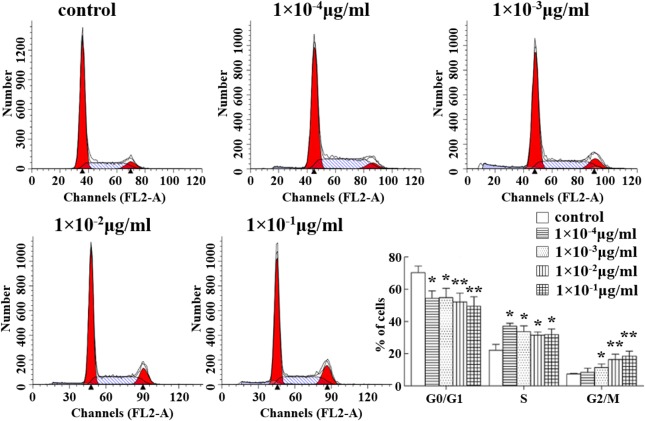
Figure 1.
Abrin P2 induced S and G2/M cell cycle arrest in HCT-8 cells Cell cycle distribution was analyzed by flow cytometry. Representative flow cytometric histograms show the distribution of cells in different phases at 48 h after treatment with the indicated concentration of abrin P2. The data are presented as the mean ± SD from six independent experiments. *P < 0.05 and **P < 0.01 vs. control.

