
Figure 11.
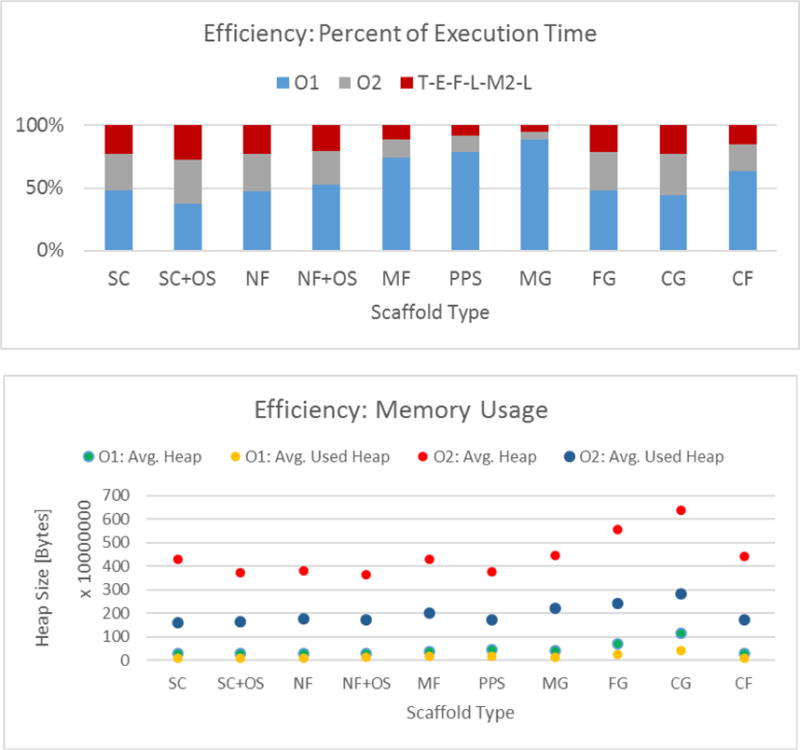
Top: Execution time efficiency for the top two performing sequences A12: T1➔E➔F➔L➔M2➔L and A22: T2 E➔F➔L➔M2➔L decomposed into O1, O2 and T➔E➔F➔L➔M2➔L computation times. Bottom: Memory benchmarks of two threshold optimization computations using O1 ~ Minimum error thresholding and O2 ~ Topological stable state thresholding approaches.