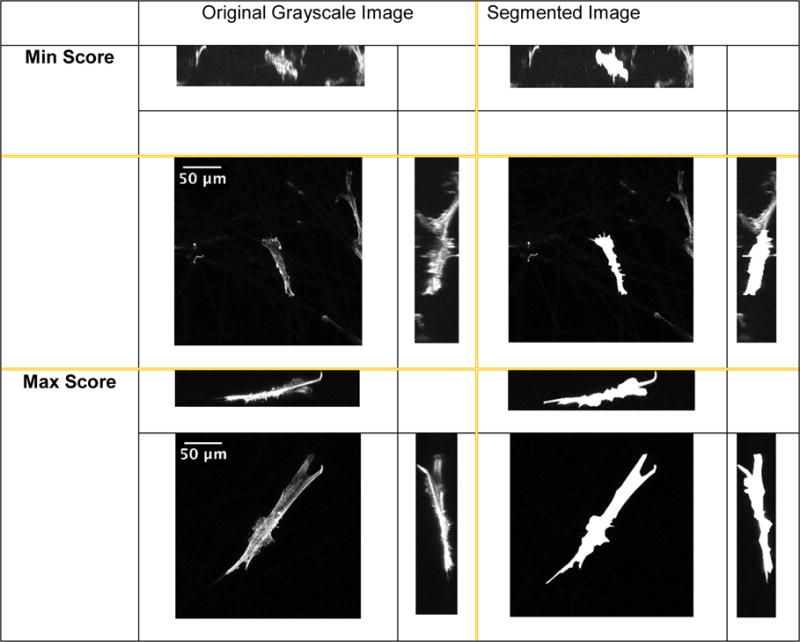
Figure 5.

Two examples of three orthogonal max intensity projections of the min (top) and max (bottom) scores for Microfiber scaffold. Left column shows the projections of the original z-stack. Right column shows manually segmented three projections of the same z-stack. The ZX and YZ projections have been scaled in the Z direction.
