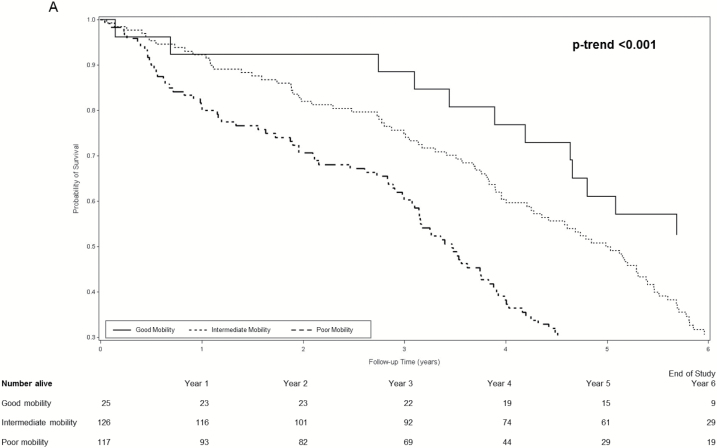
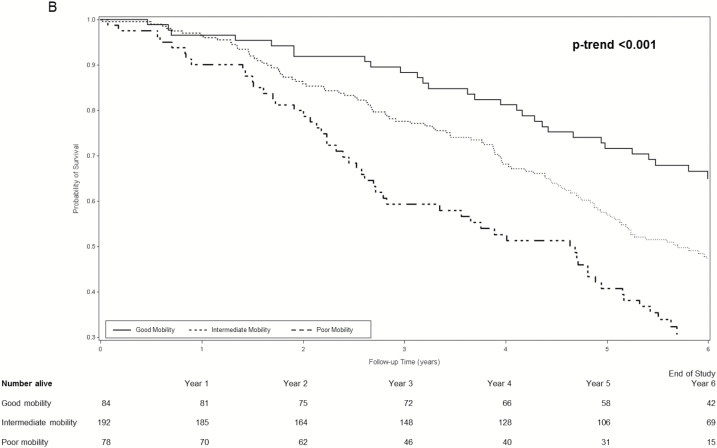
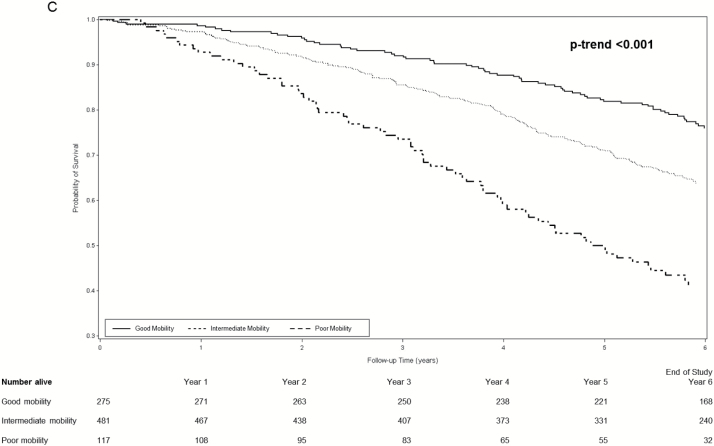
Figure 1.
(A) Cumulative survival among women with dementia according to mobility phenotype. (B) Cumulative survival among women with mild cognitive impairment according to mobility phenotype. (C) Cumulative survival among women with normal cognition according mobility phenotype. *Probability of survival adjusted for age and site.


