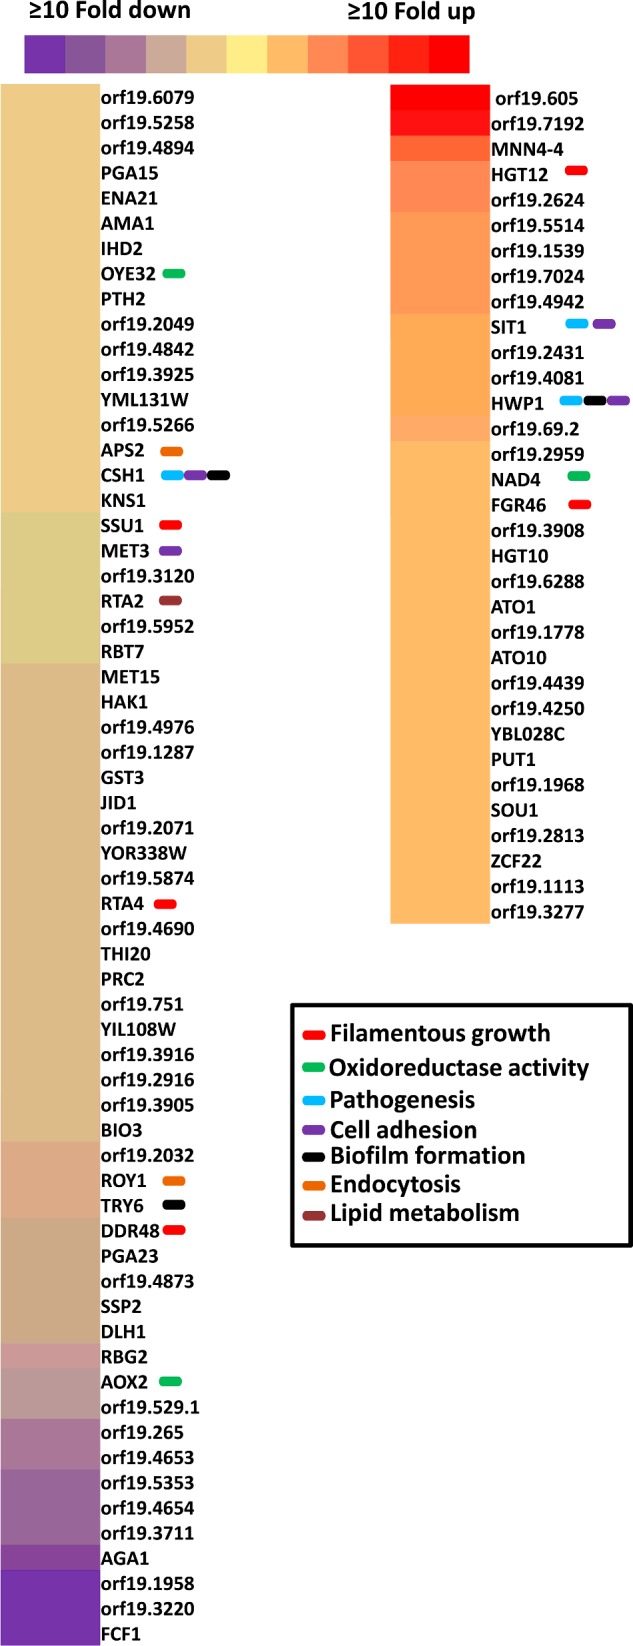
Figure 5. The comparative transcriptomic profile of mlt1Δ/Δ mutant.

The genes with ≥2-fold change are shown. The intensity of the colour represents the extent of change in the expression values with red for up-regulation and violet for down-regulation as per the scale. The affected genes involved in endocytosis, oxidoreductase, lipid metabolism, hyphal development, biofilm formation, pathogenesis and adherence are labelled with a colour box. The different colour box represents different gene categories.
