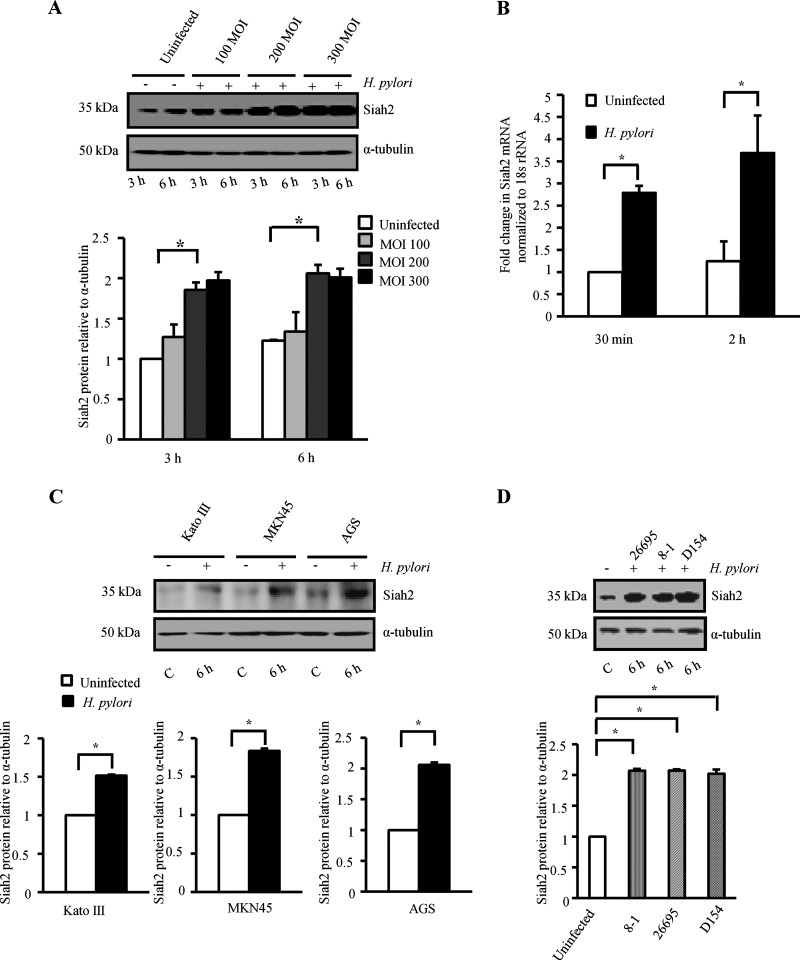
Figure 1. Siah2 is induced in H. pylori-infected GCCs.
(A) A representative Western blot (n=3) of whole cell lysates prepared from uninfected and infected (3 and 6 h with MOI 100, 200 and 300) MKN45 cells shows Siah2 induction in infected GCCs. α-Tubulin was used as a loading control. A graphical representation of the data confirms that MOI 200 at 6 h is optimal in inducing Siah2. Bars depict normalized data (mean±S.E.M., n=3), *P<0.05. (B) Siah2 expression in MKN45 cells at mRNA level as detected by real-time RT-PCR. Bars depict normalized data (mean±S.E.M., n=3), *P<0.05. (C) A representative Western blot (n=3) shows Siah2 induction in Kato III, MKN45 and AGS cells after being infected with MOI 200 of H. pylori for 6 h. Bars shown below represent normalized data (mean±S.E.M., n=3), *P<0.05. (D) Western blot results (n=3) showing expression of Siah2 in cell lysates prepared from uninfected or infected MKN45 cells. Strains of H. pylori used for the experiment were cag PAI (+) strain 26695, cag PAI (−) strains 8-1 and D154. Bars shown below represent normalized data (mean±S.E.M., n=3), *P<0.05.

