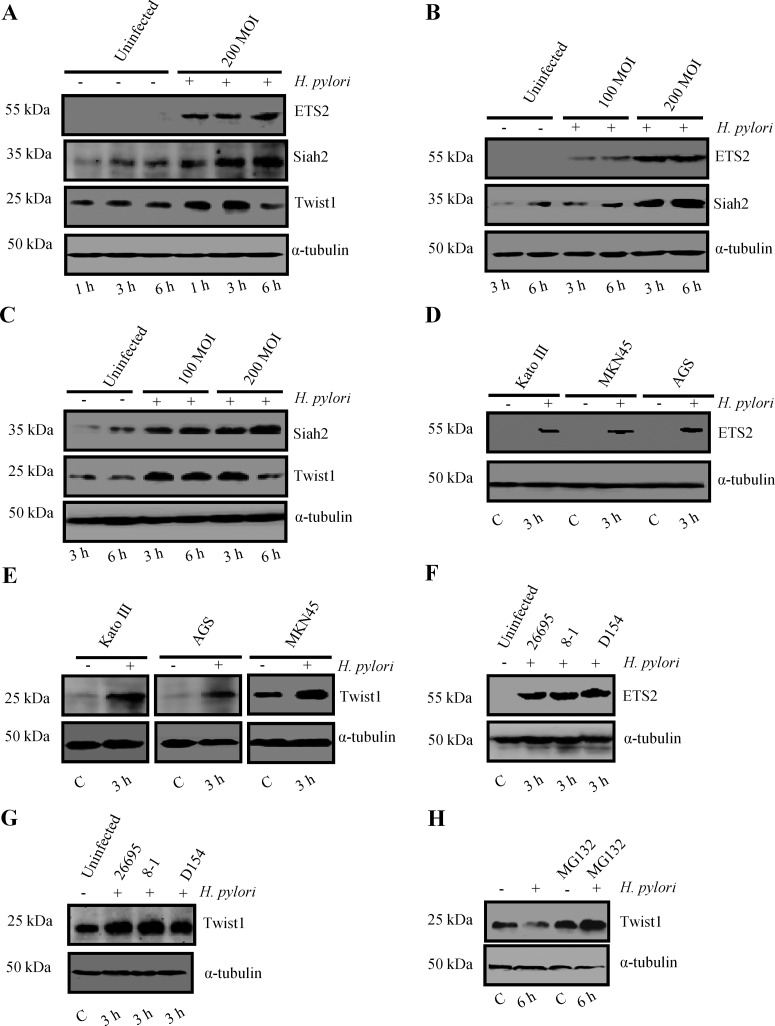
Figure 3. H. pylori infection induces ETS2, Twist1 and Siah2 expression in GCCs.
(A) Time kinetics of ETS2, Twist1 and Siah2 expression in the infected MKN45 cells (n=3). (B) A representative Western blot shows that MOI 200 is more effective in inducing ETS2 and Siah2 than MOI 100 at both 3 h p.i. and 6 h p.i. (n=3). (C) Twist1 expression pattern at MOI 100 and 200 is compared at 100 and 200 MOI and at 3 and 6 h. (D) Assessment of ETS2 expression in Kato III, MKN45 and AGS cells by Western blot (n=3). (E) Twist1 expression pattern in Kato III, MKN45 and AGS cells (n=3). (F) Representative Western blots from independent experiments (n=3) shows that strain 8-1 and D154 were equally effective as strain 26695 in inducing ETS2 and (G) Twist1 (n=3). (H) Western blot (n=4) showing Twist1 expression in MKN45 cells treated with 50 μM MG132 for 6 h prior to infection with MOI 200 of H. pylori for 6 h.

