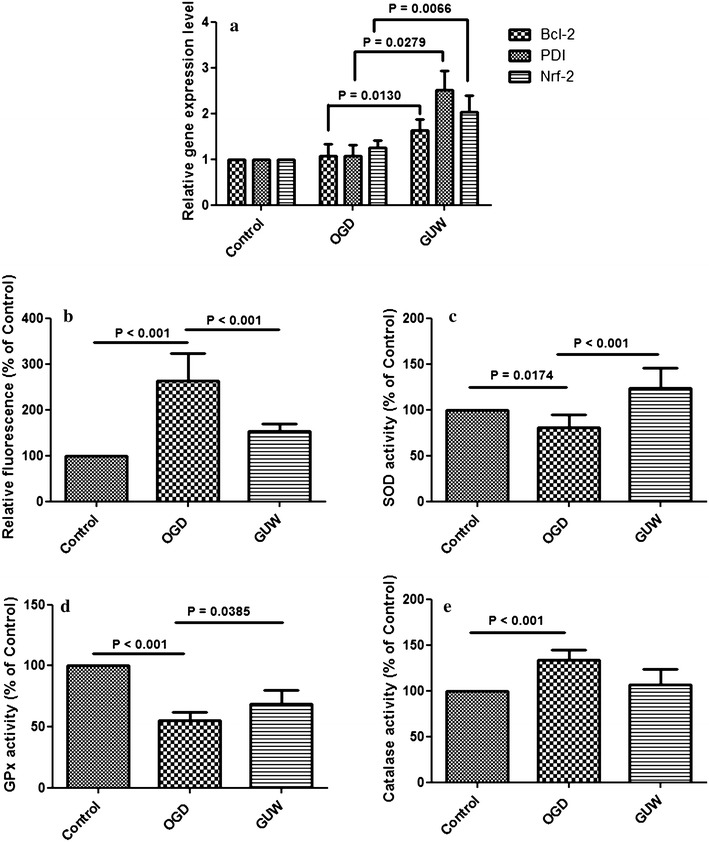
Fig. 5.

a mRNA expression levels of antioxidant and antiapoptotic genes after OGD and GUW treatment. Ct values of the genes of interest were first normalized to intrinsic β-actin of each sample, then the fold differences among each group and control was them calculated, vs OGD by one way ANOVA, post hoc Dunnett’s test (n = 4). Status of oxidative stress after OGD and GUW treatment. b Reactive oxygen species amount in between the control, OGD and GUW -treated group. The concentration of intracellular ROS was analyzed by flow cytometry. c SOD, d GPx and e Catalase activity in NGF-treated PC12 cells in different treatment groups, vs control and vs OGD by one way ANOVA, post hoc Dunnett’s test (n = 4)
