
Fig. 6.
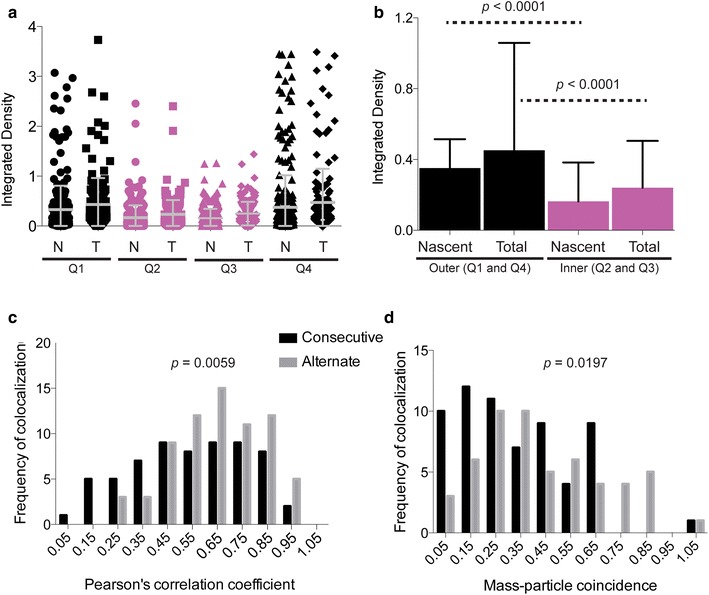
Nascent CENP-A is distributed throughout the existing CENP-A domain, with a bias toward the edges. a Quantitation of nascent (N) and total (T) CENP-A fluorescence on single chromatin fibers divided into four equal quarters. b Distribution of CENP-A loading into the outermost versus innermost quarters of the CEN chromatin domain. c The Pearson coefficient of co-localization was used to compare positioning of nascent fluorescent CENP-A pools within the CEN chromatin domain in consecutive versus alternate cell cycles. A coefficient of 1 indicates perfect co-localization. d Quantification of nascent CENP-A loading in consecutive versus alternate cycles using object-based mass-particle coincidence. A higher value indicates stronger co-localization of CENP-A fluorescence from distinct nascent protein pools