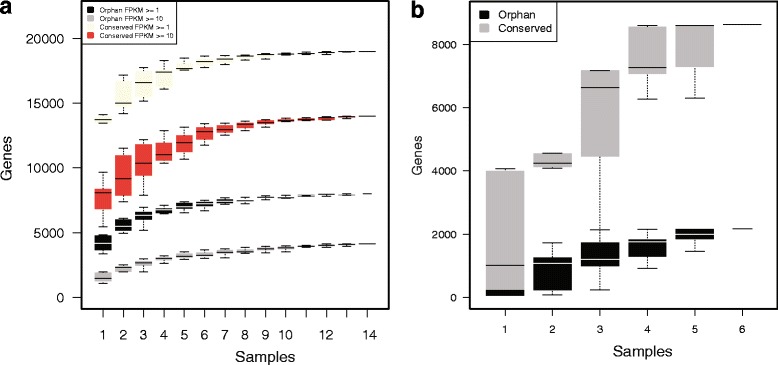
Fig. 1.

Transcription and differential expression of orphan genes. a RNA sequencing data from 14 experiments are used to determine the number of expressed orphan and conserved genes as a function of the number of RNA-seq samples (Y-axis) and different expression thresholds (FPKM > = 1 and FPKM > =10). The boxplot shows the variation in the number of expressed genes from ten random permutations of the order of RNA-seq samples b) Saturation analysis for the number of differentially expression pattern of both orphan and conserved genes from six transcriptome profiling studies [25, 28]
