Fig. 5.

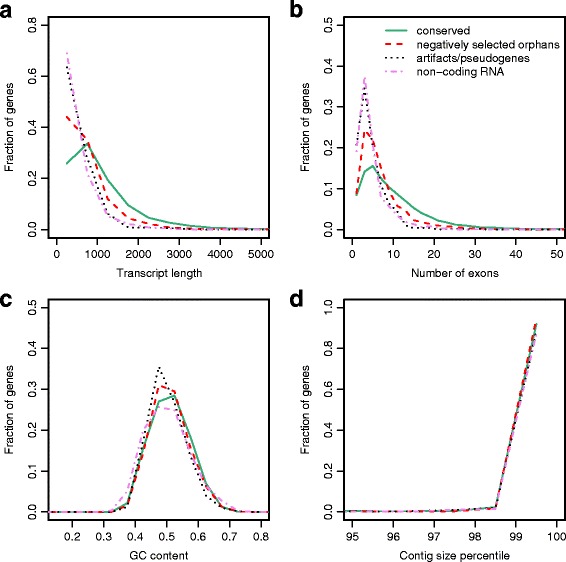
Differences between various gene classes. a Comparison of transcript length for potential prediction artifacts/pseudogenes, non-coding RNA candidates, negatively selected orphan genes, and conserved genes. The y-axis denotes the fraction of genes at a given transcript length. b Comparison of the number of exons for different gene classes. c GC content distribution for all four gene classes. d Distribution of contig size percentiles among all four classes. The top 1 % of largest contigs harbors roughly 90 % of genes for all four gene classes
