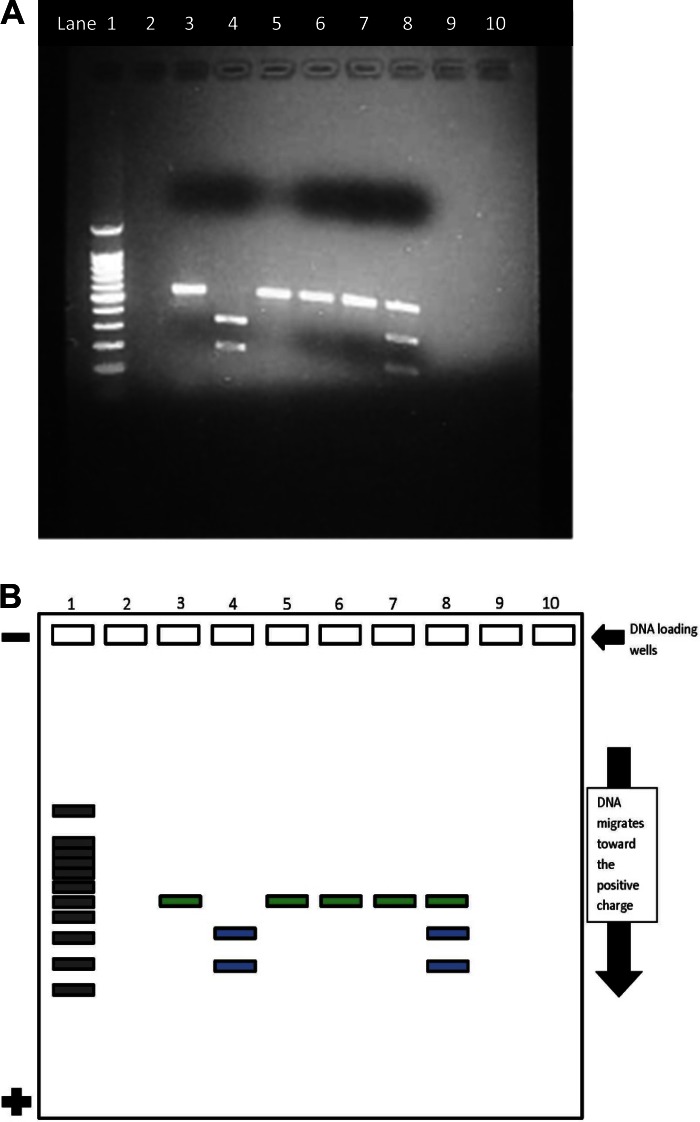
Fig. 1.
A: atypical agarose gel photo micrographic image of digested DNA from normal, homozygous, and heterozygous sickle cell samples. See B for further details. Lane 1, 100-bp DNA marker; lane 2, empty; lane 3, sample X uncut; lane 4, sample X cut; lane 5, sample Y uncut; lane 6, sample Y cut; lane 7, sample Z uncut; lane 8, sample Z cut. B: a demonstration mockup of ideal results of the sickle cell agarose gel electrophoresis in the experience. The green fill demonstrates the slow migration of the uncut DNA. In control (unaffected) individuals, the DNA is cut by the restriction enzyme (Bsu36I) and splits into two bands (blue). The lack of an enzyme site in the homozygous sickle cell patient blocks the ability of Bsu36I to cut the DNA, and, therefore, only one green band appears. In heterozygous carriers, both the uncut and cut band appear, indicating that the individual has both unaffected (green) and affected (blue) DNA. Lane 1, 100-bp DNA marker, lane 2, empty; lane 3, sample X uncut; lane 4, sample X cut; lane 5, sample Y uncut; lane 6, sample Y cut; lane 7, sample Z uncut; lane 8, sample Z cut.

