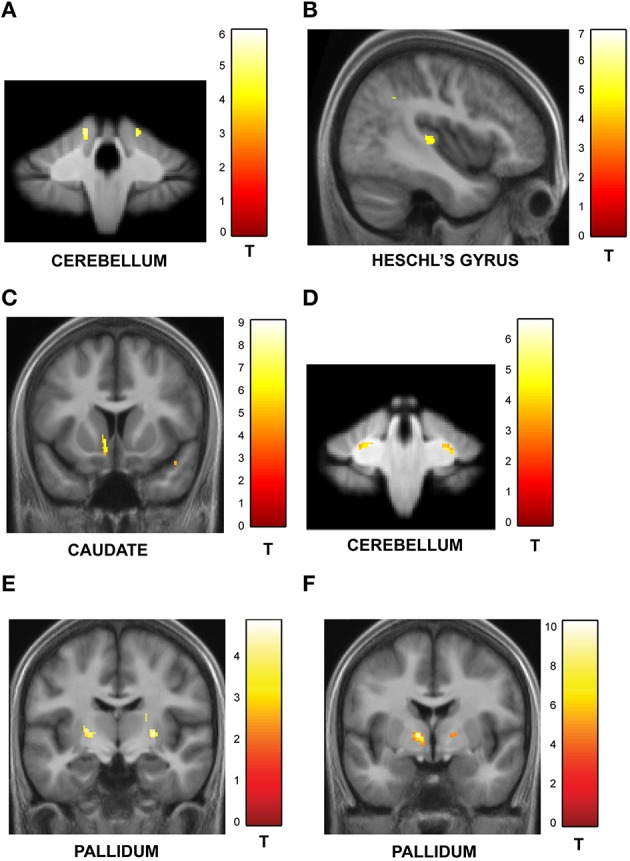
Figure 5.

Structural imaging results: correlation between GM and WM volume and behavior. All activations are reported at a threshold of p < 0.001 (uncorrected) and scaled according to the t-value maps on the right. (A) Correlation between GM volume and performance on irregular sequences. The GM volume in the cerebellum increased with precision on irregular trials as shown here. Similar effects were observed in the orbitofrontal cortex and inferior temporal gyrus (Table S1A). (B) Correlation between GM volume and performance on regular sequences. The gray matter volume of sensory areas in Heschl's gyrus increased as a function of precision on regular sequences as shown here. Similar effects were also observed in the STG, insula and middle cingulate gyrus (Table S1B). (C) Correlation between GM volume and performance on sequences with high memory load. The gray matter volume of the caudate increased with performance on sequences with greater memory load. Correlations were also observed in the insula, thalamus and the Heschl's gyrus (as listed in Table S2A). (D) Correlation between GM volume and performance on sequences with low memory load. The cerebellum showed higher GM volume as a function of precision on sequences with low memory load (see Table S2B). (E) Correlation between WM volume and performance on irregular sequences. The pallidum expressed higher WM volume that correlated with listeners' precision as a function of increasing irregularity of the sequences (see Table S3A). (F) Correlation between WM volume and performance on sequences with high memory load. The pallidum showed higher WM volume that correlated with performance as a function of increasing memory load associated with the sequences (see Table S3B).
