
Fig. 1.
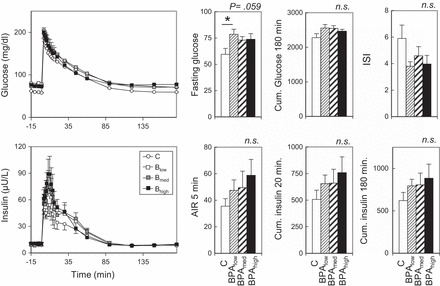
Study 1. Left: circulating levels of glucose (top) and insulin (bottom) before and after administration of 300 mg/kg glucose bolus in control (C) and bisphenol A (BPA)-treated females at ∼6 wk of age (Blow, Bmed, and Bhigh; refer to materials and methods for prenatal BPA dose details). Right: Top histograms show mean fasting glucose, cumulative (Cum.) insulin over 180 min, and insulin sensitivity index (ISI); bottom histograms show acute insulin response (AIR) after 5 min and Cum. insulin/glucose ratio at 20 and 180 min. P values at top right corner of each histogram refer to overall ANOVA results. *Significant difference (P < 0.05) between C and Blow group. All post hoc comparisons are against the C group. NS, not significant.