
Fig. 4.
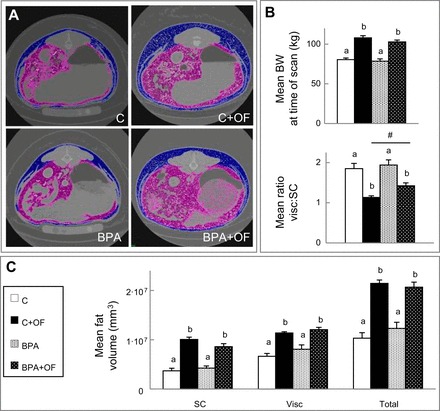
Study 2. A: representative computed tomography (CT) scans from C, C + OF, BPA, and BPA + OF animals. Visceral and subcutaneous (SC) adipose tissue depots are represented in purple and blue, respectively. B: histograms of body weight (BW) and visceral (visc)/SC adipose tissue ratio at the time of the CT scan (means ± SE). C: SC, visc, and total adipose tissue volume (means ± SE) from the 4 groups. a,bSignificant differences between groups (P < 0.05); #large-effect size difference between the BPA + OF and C + OF groups.