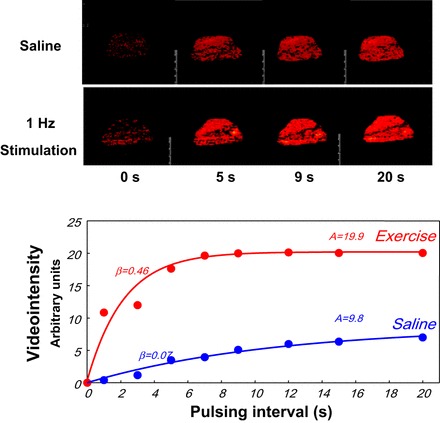
Fig. 2.

Top: contrast-enhanced ultrasound images of rat thigh muscle as a function of time after a high-energy ultrasound pulse with the muscle at rest or given a 1-Hz electrical stimulation. Bottom: greater plateau video intensity (red) corresponding to a larger number of microbubbles in the imaged volume of the stimulated muscle.
